As traditional imagery becomes more of a commodity in the mapping industry, professionals are exploring new ways to utilize different sensors in a geospatial context. Thermal imagery is a promising technology that can benefit a variety of applications, although it remains underutilized in large-scale geographic acquisitions.

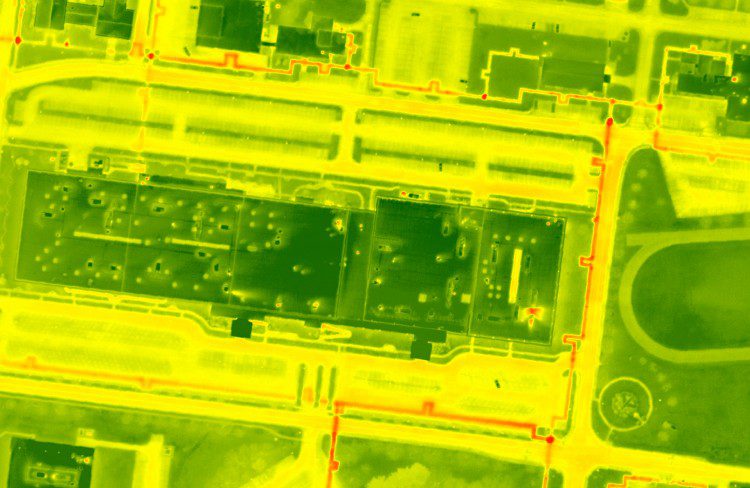
A FLIR Systems SC8303 sensor captured this color-ramped thermal image, which details subsurface utility concerns identified by red (hot) locations detected below the surface. Various plumes also are visible from rooftop penetrations and building facades.
Thermal sensors are complicated devices capable of capturing the amount of infrared radiation emitted by an object. The amount of emitted radiation is directly relatable to temperature, as hot surfaces radiate more energy than cold surfaces. Hotter objects present a brighter image, while colder objects present a darker image.
At two project areas in southeast Ohio, a FLIR Systems SC8303 sensor was used. This scientific-grade camera features highly sensitive cooled detectors that produce high-resolution thermal images. It's important to note that the wavelengths detected by this sensor aren't visible to the human eye, and it can sense and measure a wide range of temperatures on manmade structures, in water bodies, on Earth's surface and underground.
To use the FLIR SC8303 within a geospatial context, the sensor was integrated into the aerial-acquisition process: flightlines and altitudes were determined, ground control was identified, and the individual captured frames were stitched into a mosaic. After reviewing the specifics, the flying altitudes were determined to be 880 meters AGL and 800 meters AGL, respectively. Ground control was established via existing high-resolution imagery, with careful attention paid to identify locations visible in traditional RGB imagery and thermal images.
With flight planning complete and ground control identified, data collection was executed on a January night to optimize conditions. By acquiring in the winter months and at night, temperature differences within structures and on the ground were maximized. Data processing included complete aerial triangulation, orthorectification and mosaicking. At the end of this process, two thermal mosaics were created: one approximately 1.7 square kilometers at 0.25 meter GSD, and one approximately 2.5 square kilometers at 0.22 meters GSD. The absolute accuracy of the thermal orthoimagery was concluded to be ~60 centimeter RMSE (two ortho pixels).
As a final process, remote-sensing methodologies were used to normalize the orthoimagery and create a vector dataset for use in a GIS. Such vector data was useful in analysis, providing the ability to easily identify, select and quantify thermal anomalies across an entire area of interest.

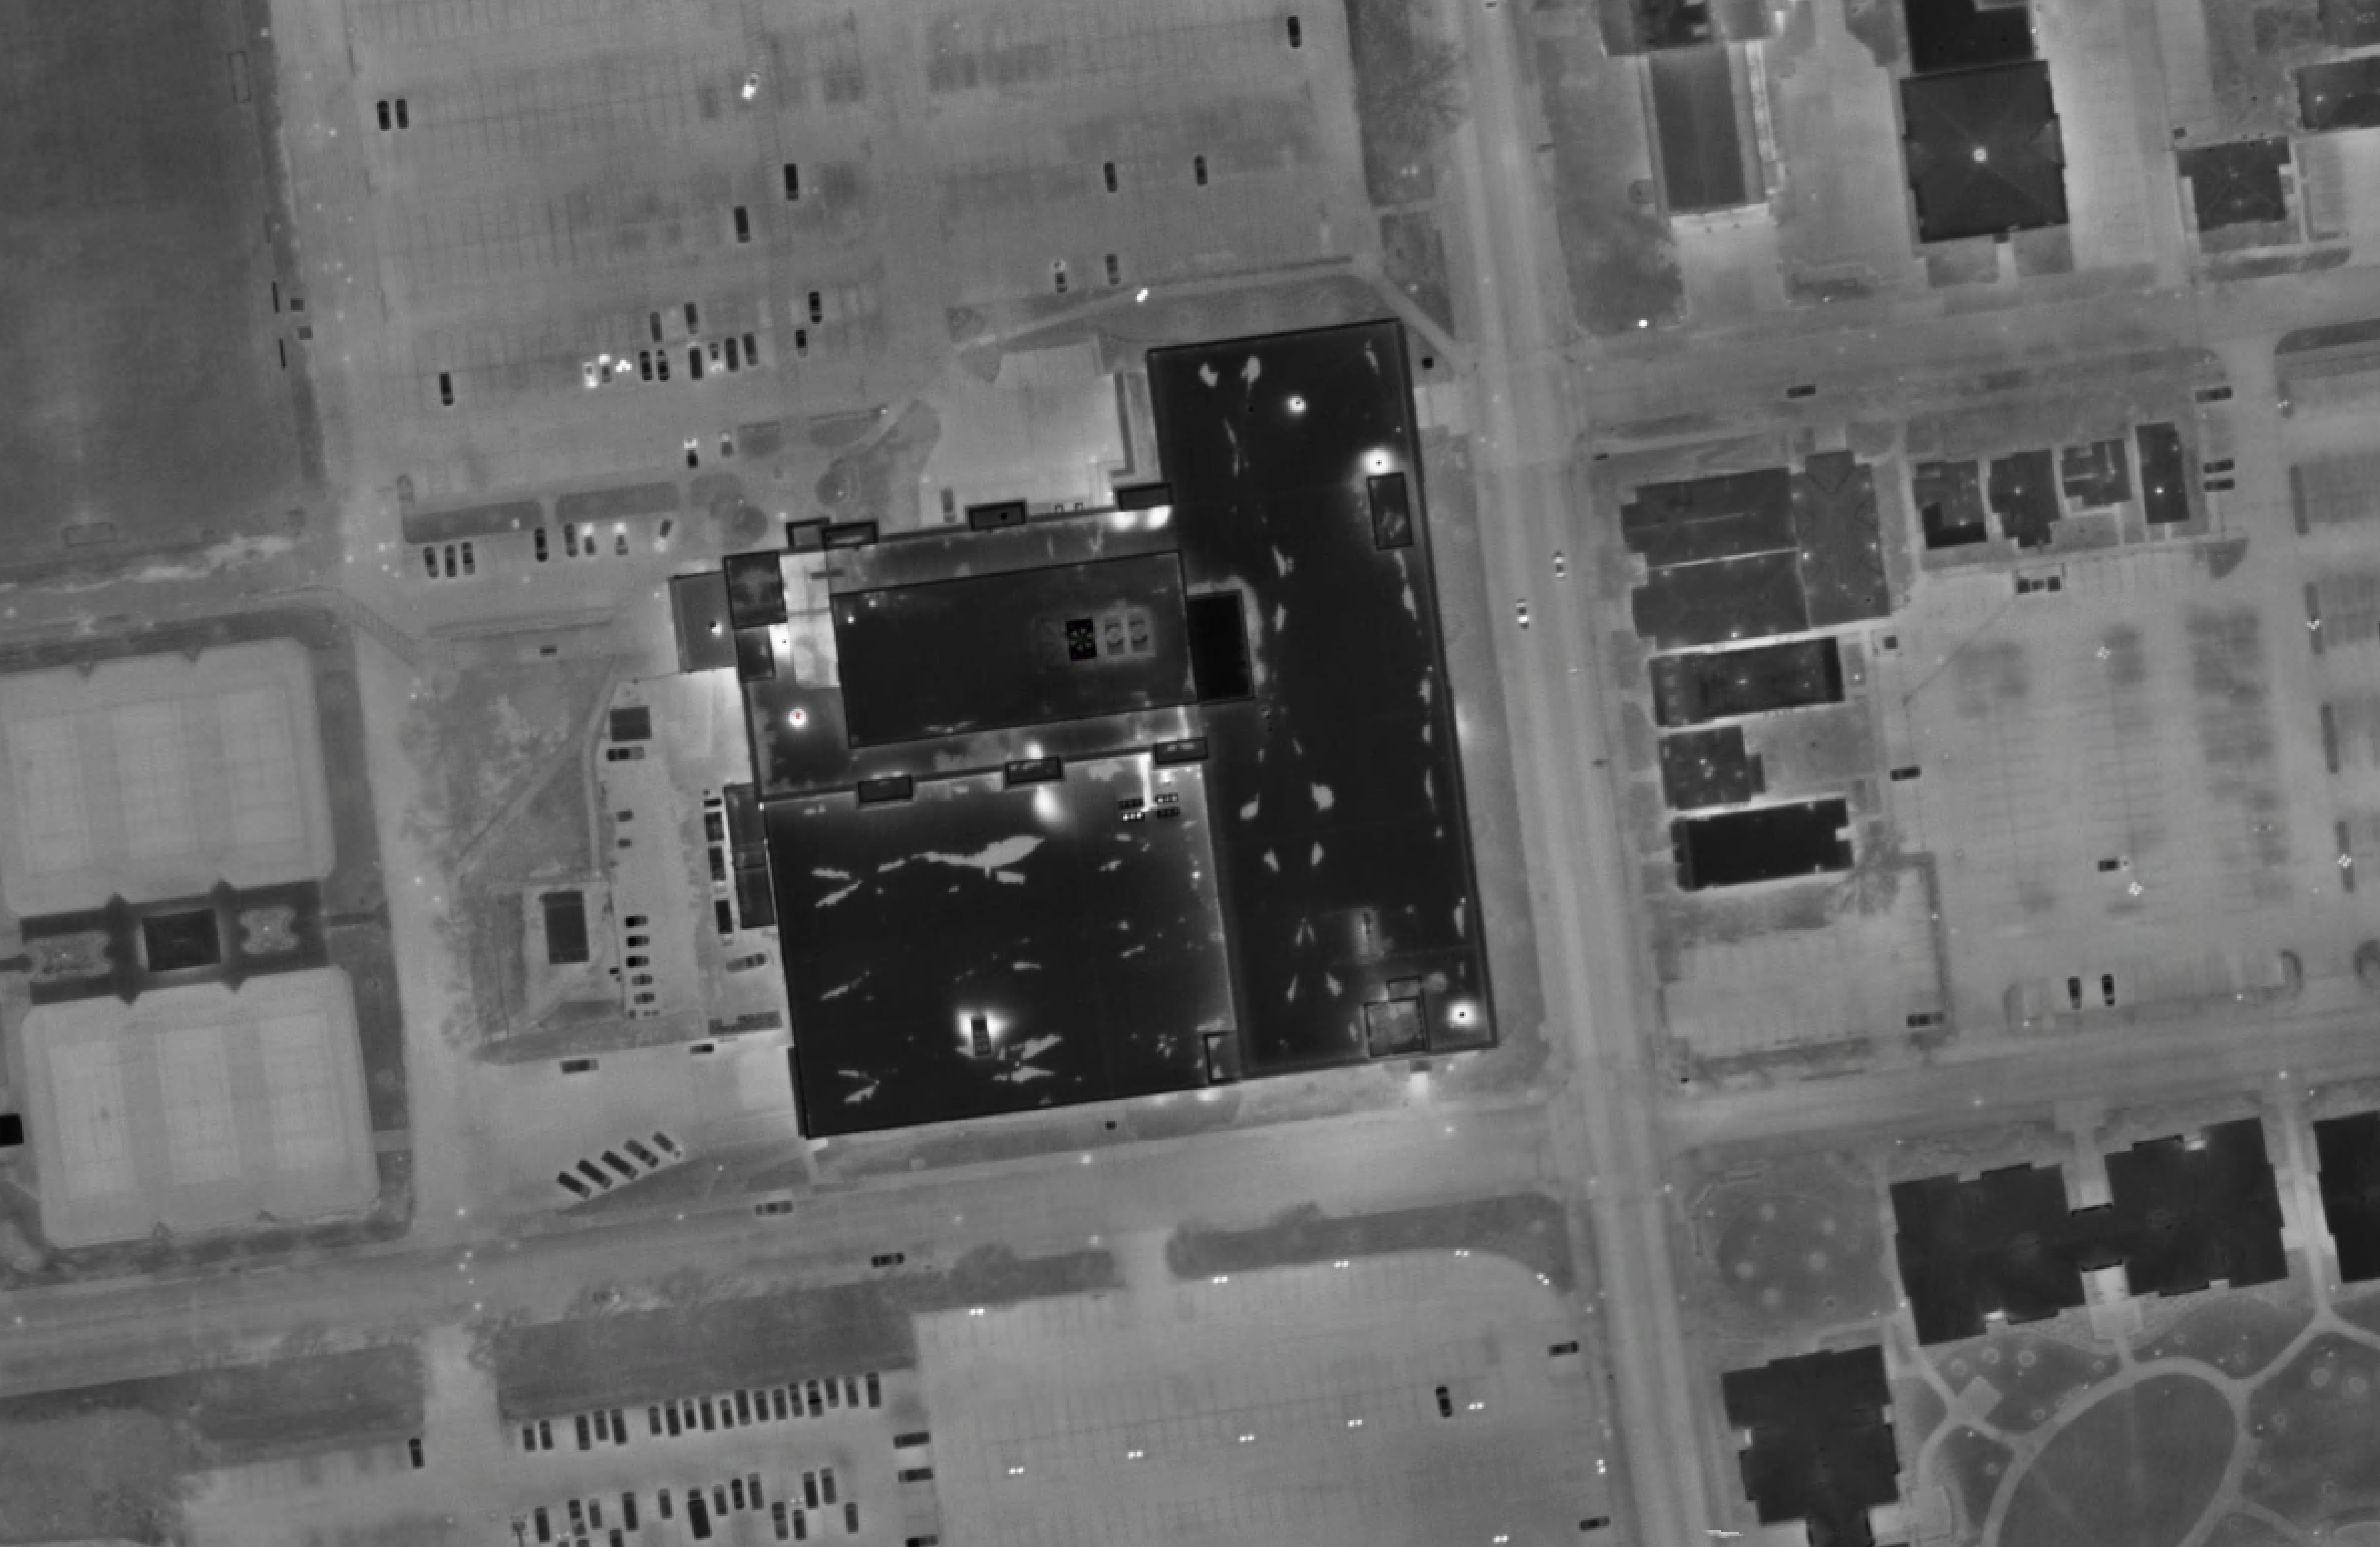
Another image taken by the FLIR sensor shows various temperature anomalies and condition issues on a building roof. Bright spots indicate areas of heat loss and/or moisture retention.
Thermal mosaics have proven useful to a variety of resource-monitoring applications:
Building Condition Analysis
Variations in thermal images can identify potential moisture in roof structures, bad insulation and poor performance of individual roofing sections. Aerial thermal imagery allows staff to evaluate an entire campus without visiting each structure. By using a large-scale thermal image, building and campus managers can quickly identify problematic areas across a large extent from a worst-first perspective, instead of relying on work orders, age or other arbitrary data points.
HVAC Equipment Performance
Thermal images can help evaluate the performance of Heating, Ventilation and Air Conditioning (HVAC) units. In some cases, HVAC units are configured incorrectly”instead of heat being blown into a facility, interior heat is blown into the outdoors. All rooftop structures can be evaluated for correct configuration and efficiency, because the thermal image can indicate where certain units are working harder than nearby counterparts.
Utility-Line Analysis
The temperature difference associated with steam and chilled water lines is visible on thermal imagery, allowing utility staff to correctly locate and place these linear utilities without disrupting soil. In some cases, thermal imagery compared against legacy GIS/CAD vectors illustrate a substantial mismatch between perceived and actual locations. In addition, the thermal signature can highlight areas of subsurface leaks and poor line insulation. By identifying subsurface leaks, utility managers can effectively isolate these areas for repair and eliminate the associated energy loss.
Energy Auditing
By analyzing thermal imagery along with utility bills, weather patterns, building use, HVAC load and building condition, energy experts can remotely sense and audit a campus' energy use. Thermal anomalies, heat plumes, and other temperature differences help energy auditors better identify and address energy-conservation measures. Geospatially accurate thermal imagery is important, as understanding the intensity of the image along with its location helps auditors identify concerns and quantify impact.
Environmental Analysis
The variations associated with thermal images also help identify vegetation issues, grading concerns, pollution drainage into water bodies, light pollution and air-emissions concerns. Again, geospatially accurate thermal imagery is particularly important, as legacy vector data can be analyzed along with the thermal data to identify and monitor concerns not visible to the human eye.
Thermal imagery has always had utility in the presentation of individual image frames, but stitching these frames into a comprehensive, geospatially accurate dataset opens new possibilities. By understanding how to accurately map and quantify thermal anomalies, the geospatial industry will derive new and unexpected benefits, especially as sensors become more sensitive and aerial-acquisition platforms change.
Daniel Michalec is an associate with Woolpert's Energy group: e-mail: [email protected].

