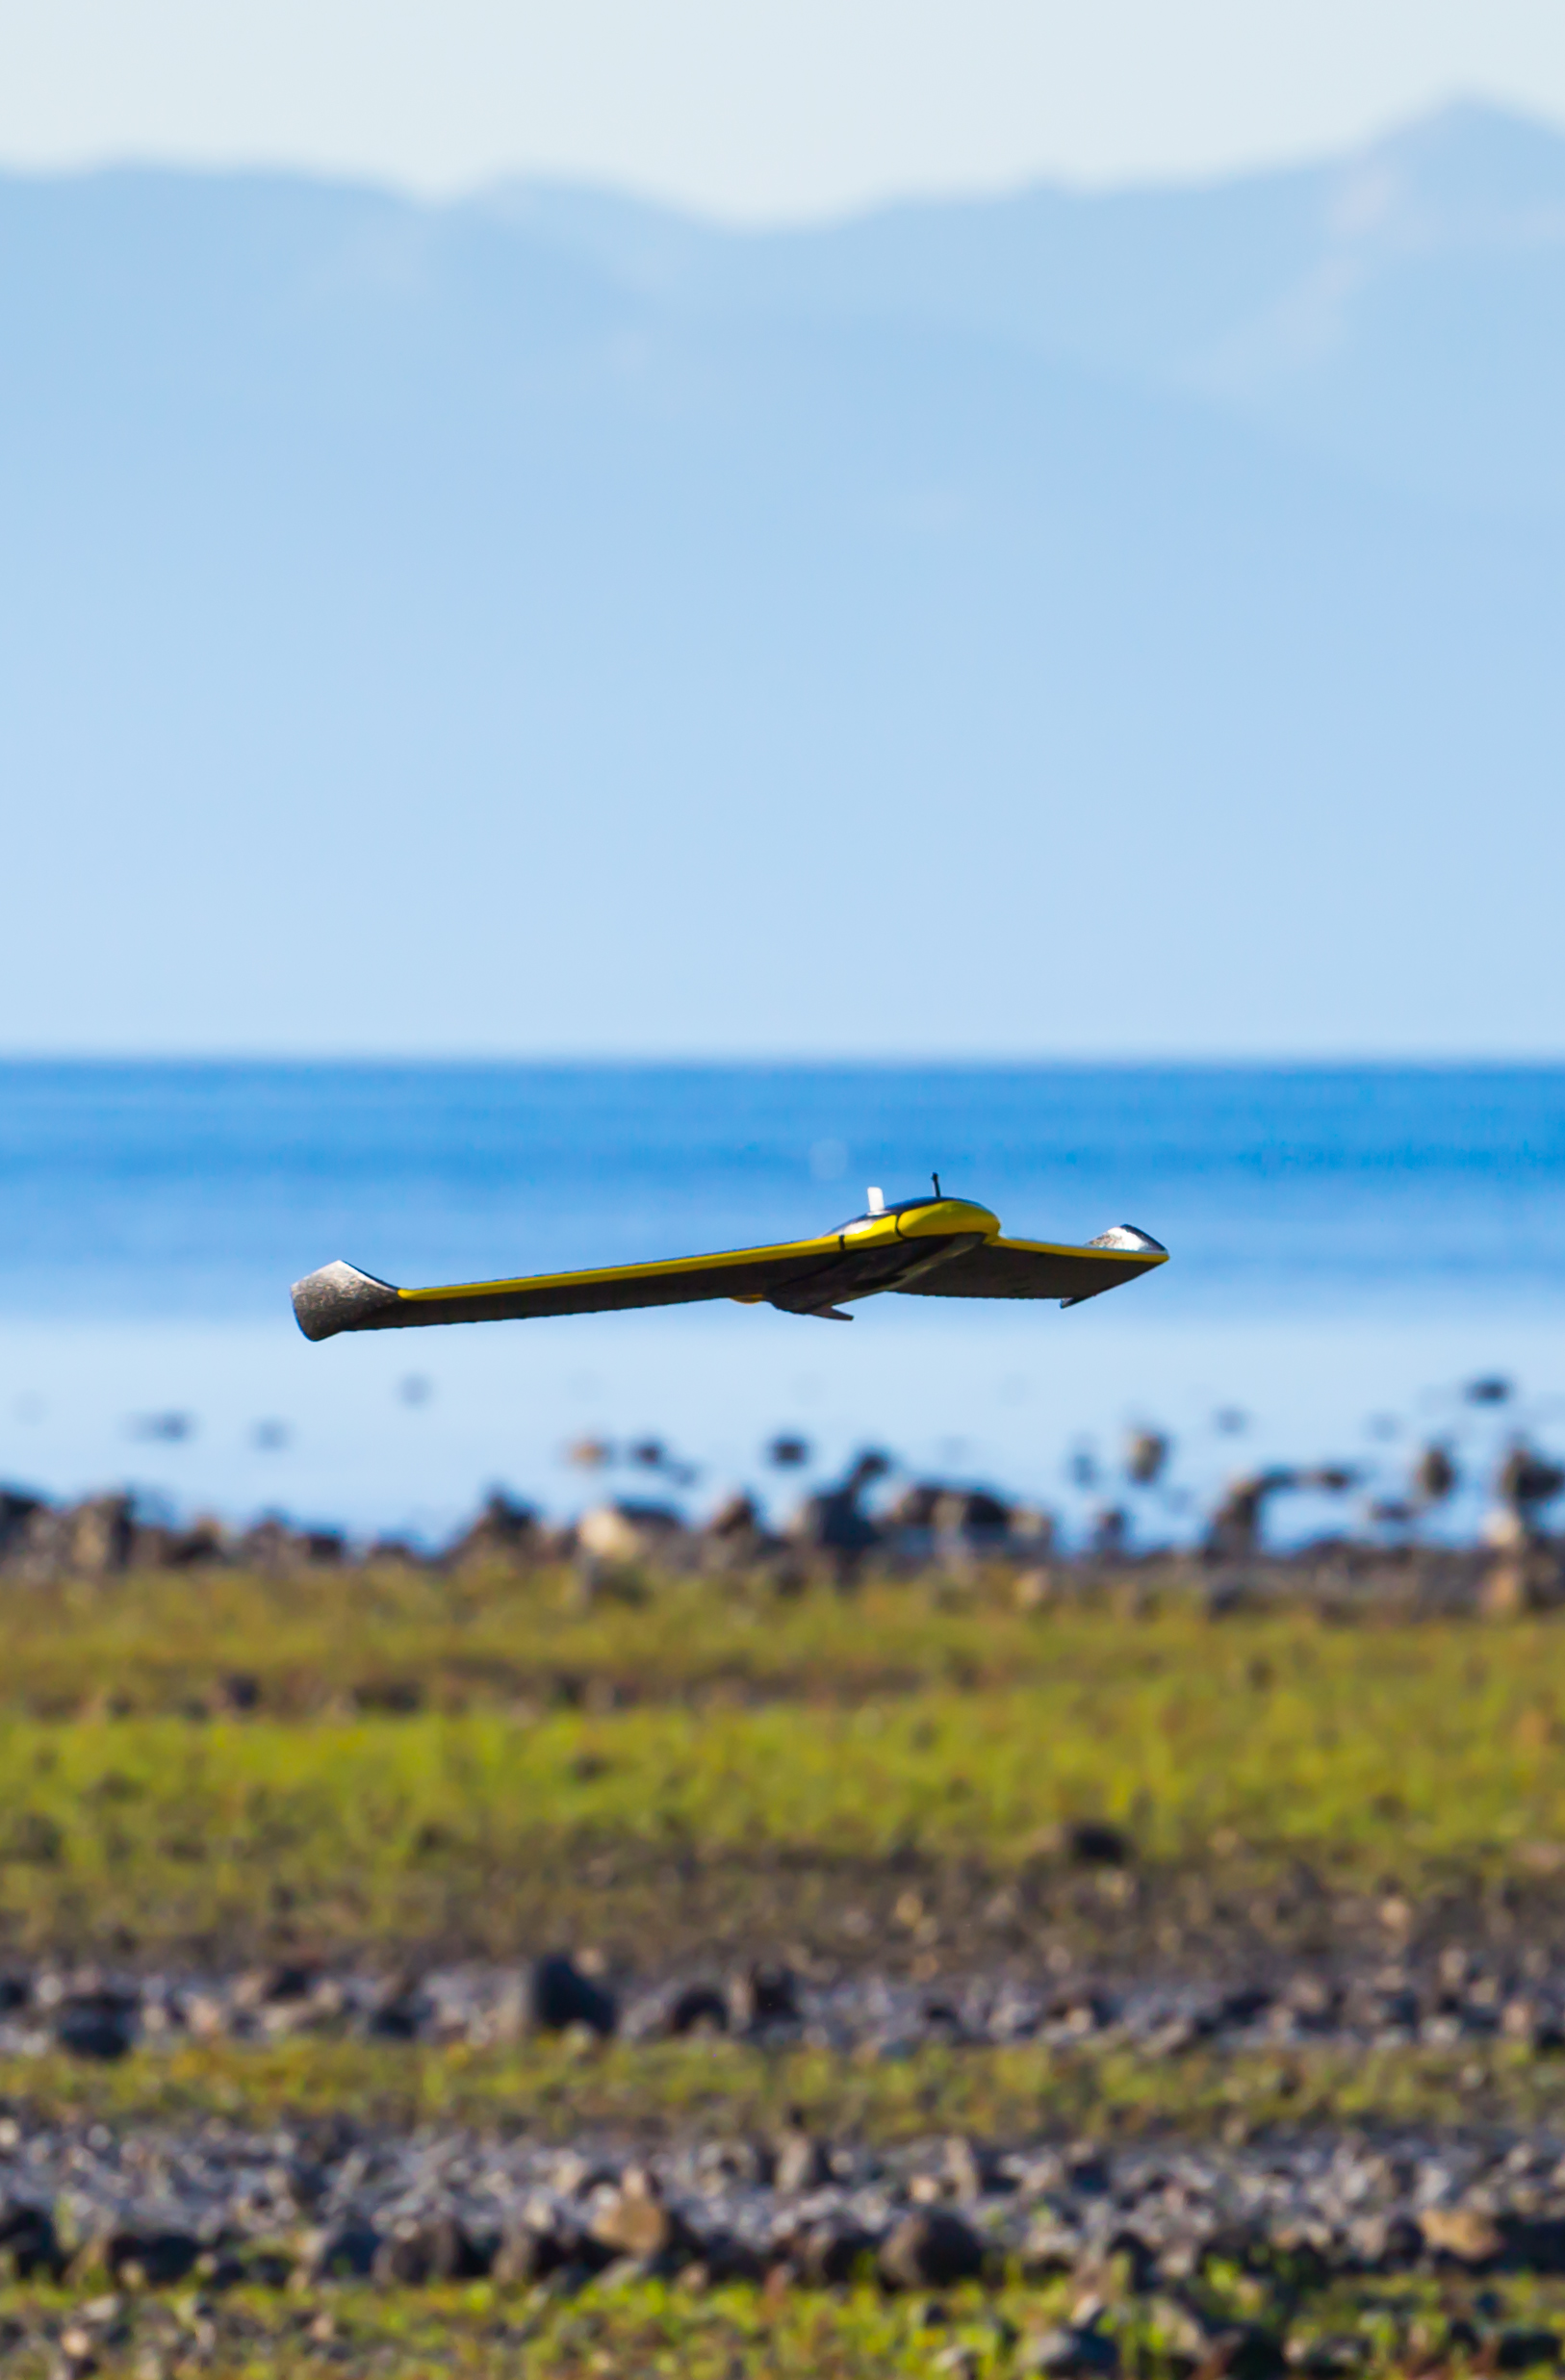
The senseFly eBee's flight operations are entirely autonomous. An infrared sensor enables it to locate the ground during landing. (Credit: Matt Bansak, http://mattbansak.com)
By Jarlath O'Neil-Dunne
It's early Monday morning, you're late for a meeting, and you see an empty space on your right“just as the car in front of you suddenly puts on its signal and slides in. It takes 10 minutes of driving around in circles before you find a space. Why can't cities just increase the number of parking spaces?
Determining the optimal parking capacity for a community isn't easy. A lack of parking capacity can cause commerce to suffer, but too much parking can cause people to drive in single-occupancy vehicles when they could carpool, bike or take public transport. Parking also takes up valuable space that could be used for commercial properties that pay more taxes or bike lanes to increase alternative transportation.
It's difficult, if not impossible, to address issues relating to parking capacity without first conducting a parking inventory. The traditional approach is to send field crews to manually inventory spaces, which is difficult to complete in a timely manner. The longer the inventory takes, the less it reflects the intent to understand how much of the capacity is used in a single point in time. Even for a small downtown area with a few thousand parking spaces, conducting an accurate inventory in a small time window requires dozens of personnel.
A Remote-Sensing Solution
Remotely sensed data provide a snapshot in time, and thus seem perfect for a task such as parking-capacity inventory. Until recently, however, remote-sensing systems suffered from shortcomings that made them ill-suited to the task: satellite imagery lacked sufficient spatial resolution, and aerial imagery was never cost effective for small areas.
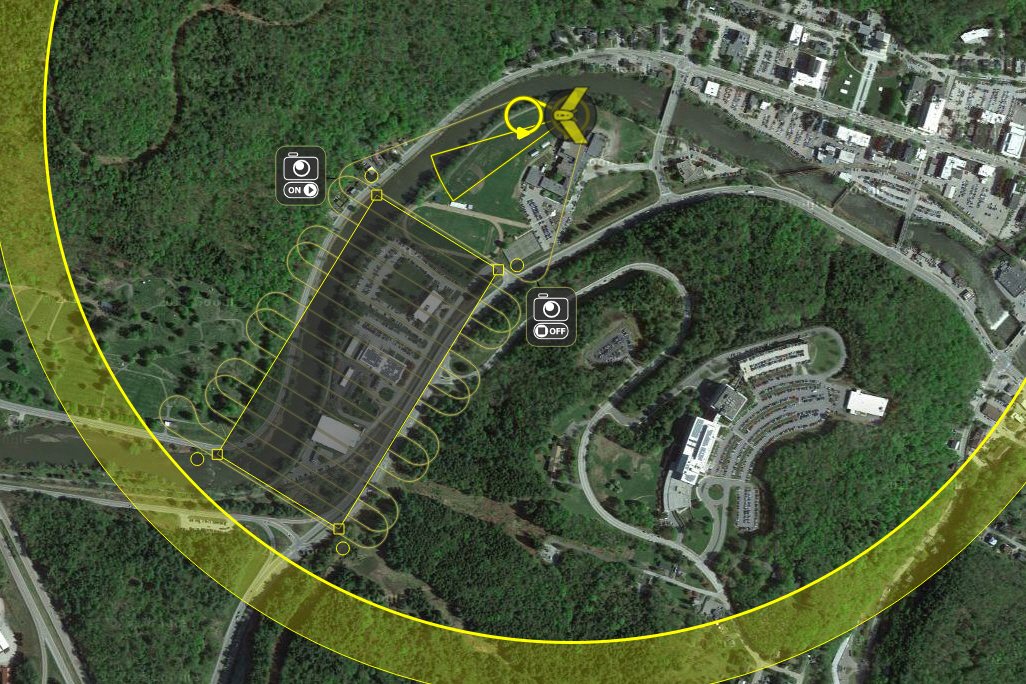
A UAS flight plan was developed using eMotion software based on user-defined parameters such as resolution, overlap, altitude, location of takeoff and landing sites, and operating radius.
Fortunately, a lot has changed in the last few years. Satellites now can collect imagery with resolution in the tens of centimeters, and Unmanned Aircraft Systems (UASs) can acquire imagery at a fraction of the cost of manned systems. With UASs being easy to deploy, they offer a decisive advantage that goes beyond price“the ability to collect imagery of the area you need when you need it. The main challenges in employing UASs are regulatory. Commercial UAS operations require an FAA exemption, which comes with a host of stipulations.
With funding from the U.S. Department of Transportation, the University of Vermont (UVM) has been testing UASs for a variety of transportation-related uses, recently forming an interdisciplinary UAS team that pulls in faculty, staff and students from across campus. When a community approached UVM to see if UAS technology could be used to assess parking capacity, it represented a unique opportunity.
Up to this point, we had been focusing mostly on disaster-response operations, says Sarah Leidinger, a recent UVM graduate who now is one of the senior technicians on the team. It never occurred to us that UASs would be useful for this type of work.
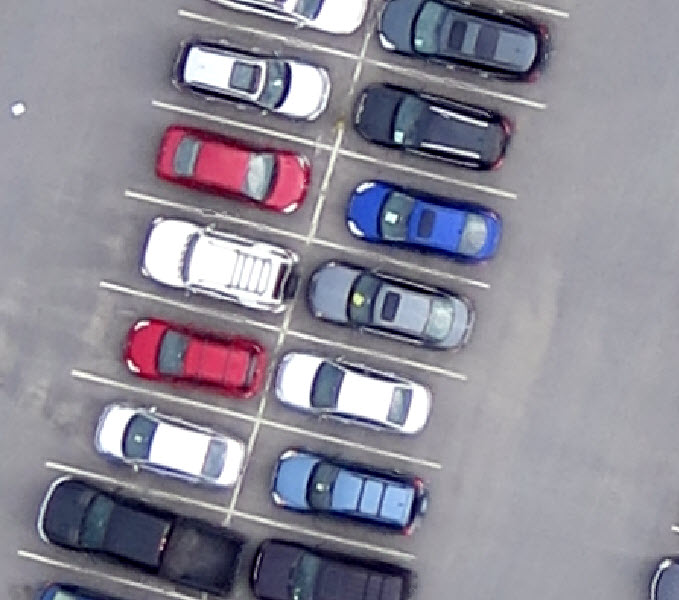
The high-resolution nature of UAS imagery makes it possible to see features such as line markings, which typically aren't visible in most aerial and satellite images.
UVM has been operating a senseFly eBee: a small, lightweight, fixed-wing UAS specifically designed for mapping. The eBee is part of a fully integrated hardware and software solution that consists of flight planning, image acquisition and data processing. According to Tayler Engel, who leads many of the team's UAS missions, the comprehensive solution made the eBee particular appealing because it enables us to go from launch to orthorectified imagery in a matter of hours.
The eBee's imaging system is a modified digital camera“although perfectly adequate, it's hardly sophisticated“but the integrated GPS and wind sensors are high-tech, ensuring autonomous, seamless data acquisition. The fixed-wing foam construction, combined with its light weight (1.52 lbs), proved appealing from a safety standpoint: should the UAS lose power, the risk of it causing damage is substantially lower that comparable quadcopter systems. Powered by a lithium-ion battery, the eBee has close to 45 minutes of flight time under optimal conditions.

A point cloud of a parking lot was derived from UAS imagery containing more than 40 points per square meter. The point cloud is derived from stereo images through an automated process.
The UAS team carried out three flights at different time periods, capturing imagery of 2,195 parking spaces during each flight. To ensure compliance with regulations, all flight operations were preceded by airspace coordination and landowner permission. The team used the eBee's flight-planning software, eMotion, to specify the flight path and input key parameters such as image overlap (70 percent for lateral and longitudinal) and target resolution (3.5 centimeters).
Total flight time to collect imagery was 32 minutes on average, with approximately 300 individual images acquired during each flight. To post-process the imagery, the team used the Postflight Terra 3D software package, a customized version of the Pix4D digital photogrammetric solution specifically optimized for the eBee.
A Postflight project is created upon landing in which individual images are synced with flight logs. The processing in Postflight requires minimal user input as it proceeds through a series of steps including image georegistration, camera calibration, quality checking, aerial triangulation, bundle-block adjustment, point-cloud densification and color correction.
It's an easy process, notes Nathanial Ward, a UAS team technician. After a few mouse clicks, its simply CPU time. For each flight, we had a 3D point cloud in LAS format, a raster Digital Surface Model (DSM) and an orthophoto mosaic within about 3 hours.
Counting Cars
The initial approach to inventorying parking capacity from UAS imagery was simple: an analyst manually interpreted the imagery to create a point database of parking spaces, where were then attributed with status (occupied or unoccupied) for each of the three time periods. It took a single image technician six hours to create the initial inventory of parking spaces, then two and a half hours to update the parking inventory for each time period. The workflow was considerably faster than completing a comparable field inventory, but technicians working on the project described it as tedious and boring. UAS flight operations, not surprisingly, are a lot more fun than counting cars.
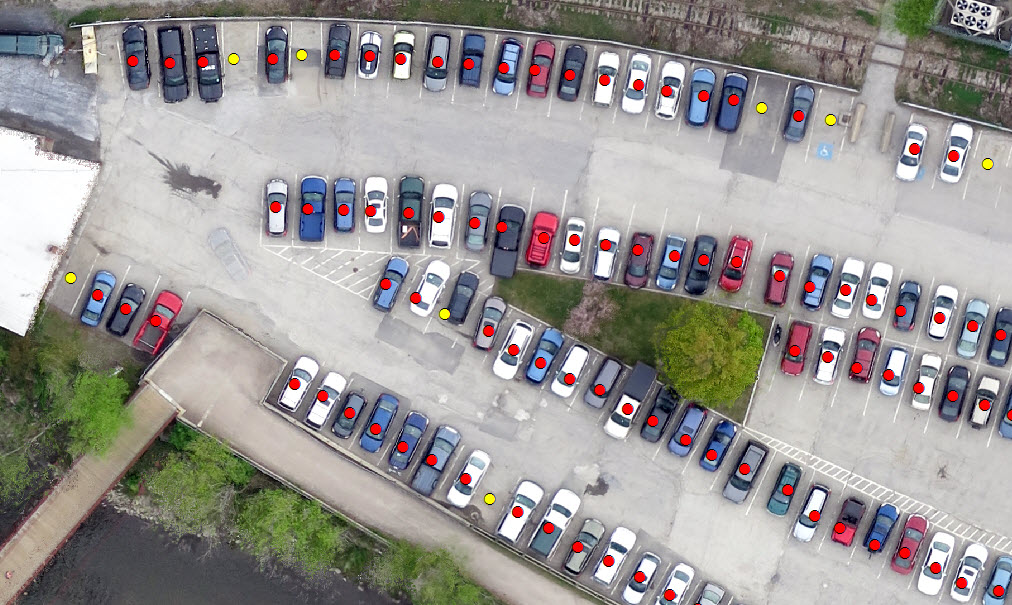
Parking-occupancy automated output is displayed over UAS imagery (red for occupied, yellow for vacant). The automated routine was highly successful, but poor parking did affect the algorithm, such as the incorrectly identified vacant location in the image's center.
This led the team to wonder, could this process be automated? Doing so would speed up the process, allowing inventories to be conducted at more-regular intervals for a lower cost. Yet despite advances in automated feature extraction, humans remain the gold standard in high-resolution mapping. Even someone with no formal remote-sensing training has little difficulty mapping cars from overhead imagery. People draw from years of experience and combine that experience with cognitive skills that enable depth to be perceived from 2D imagery using subtle cues such as shadows.
Automated feature extraction also has high startup costs. The analyst, computer hardware and computer software all cost more than manual approaches. Therefore, it makes the most sense to develop automated solutions when economies of scale come into play. From a purely technical standpoint, it's most straightforward to employ when the features of interest have consistent properties.
Developing an image-centric automated approach that identified all types of cars from UAS data didn't make a lot of sense. The data were exceptionally high resolution, covered small areas and had limited spectral information; properties that don't lend themselves to automated feature extraction.
The features of interest“automobiles“are highly variable. A single parking lot may contain cars, pickup trucks and vans with varying colors, size, shape, configuration and orientation. The paved surfaces on which cars were parked also were highly variable, with inconsistent tones, texture and shadows. The popularity of gray cars, combined with the limited spectral information in the imagery, meant that features of interest often were strikingly similar to the background.
Fortunately, some members of the UAS team were just wrapping up a project funded by the National Science Foundation (NSF) that focused on finding innovative solutions for extracting information from nontraditional types of imagery. Working with researchers from Washington University and the University of North Texas, the NSF-funded project developed a technique for generating 3D models of trees using imagery captured from mobile phones. The team used that data to make virtual measurements to improve urban forest monitoring.
Unfortunately, the process of making the 3D models and measurements proved to be far less efficient than physically measuring the trees. Given that one of the outputs of the UAS image-orthorectification process was a 3D model, the team wondered if the same techniques could be applied to counting cars in parking lots.
The raster DSM plays a crucial role in creating the UAS image mosaic, removing distortions associated with terrain. The DSM is created from the point cloud, which is created from finding matching locations in two or more images acquired from different perspectives. The high overlap of the UAS imagery meant that any location in the acquisition area was typically covered by five or more images, yielding point clouds that had more than 40 points per square meter. Although UAS point clouds are impressive, they're not the same as LiDAR point clouds. They don't contain return information, so they're challenging to process into Digital Elevation Models (DEMs) in which aboveground features are removed. Creating a DEM would've further increased the cost of analysis.
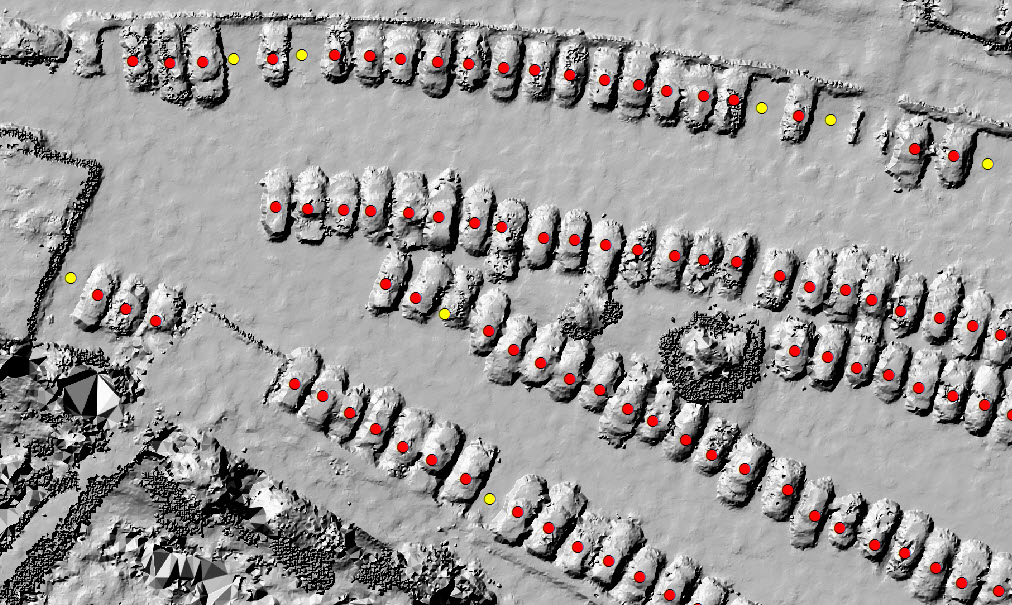
Parking-occupancy automated output is displayed over a UAS DSM (red for occupied, yellow for vacant). Cars are visible because they're taller than the surrounding pavement.
The DSM clearly showed the presence of cars, and, unlike imagery, cars in the DSM had more-consistent characteristics. Specifically, they were taller than the surrounding pavement.
Using Trimble's eCognition object-based feature-extraction software, the team developed an automated parking-lot inventory routine. eCognition allows for raster, vector and point-cloud data to be integrated into a single workflow, enabling the team to use parking-lot point locations, UAS imagery and the UAS DSM.
The routine, built upon the NSF work, wasn't overly complex and consisted of a rule-based expert system within eCognition. At each predefined parking-lot location, the routine segmented the imagery into objects, determined the height of objects based on the DSM, and then compared the height of the lowest objects (assumed to be the parking lot) with the highest objects (assumed to be cars). If there was a large-enough concentration of taller objects, the space was assumed to be occupied, and the attribute for the point in the parking-lot database was updated accordingly. The only output from the routine was an updated database table containing the parking-spot ID and its new occupancy status.
The automated routine was applied to UAS imagery for one of three separate time periods. It sped up the process by 80 percent compared to manual interpretation and required little user intervention. When it came to identifying parking occupancy, the automated routine was 94 percent accurate, performing well in difficult situations such as the presence of nearby guardrails, light poles and fences. It did, however, struggle when cars were in building shadows, parked close to each other or parked in the middle of two spaces.
UASs will lead to new uses of remotely sensed data previously never considered due to the cost of data acquisition. Automated routines can reduce costs for long-term monitoring, but they come with slightly lower overall accuracies. The overall limitation of UAS surveys is that they're only effective during daylight hours.
UAS data can help communities make more-informed decisions about their parking infrastructure, but at least for the foreseeable future, they won't help drivers actually find a parking spot.
Jarlath O'Neil-Dunne is the director of the University of Vermont Spatial Analysis Laboratory; e-mail: [email protected].

