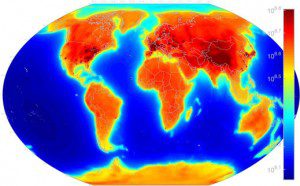
This first ever map of global neutrino emissions highlights concentrations of natural radioactive elements and manmade nuclear fission. (Credit: MATLAB)
A map published in Nature Scientific Reports shows what the world would look like if we could see the trillions of neutrinos that emanate from the surface of the planet each second. Dark spots on the map indicate nuclear reactors and parts of Earth's crust rich with radioactive uranium and thorium, which emit neutrinos when they decay.
According to William McDonough, a geophysicist at the University of Maryland, the map was created using neutrino signals captured in two detectors, one in Italy and one in Japan. The rest of the map was constructed using data about the composition and density of Earth's crust and the location of the world's reactors.
Dark patches appear around mountain ranges, where there's a lot of naturally occurring radioactive decay. Some of the dark spots are from reactors, but these are actually antineutrinos”the antimatter counterpart to neutrinos.
The detectors employ building-sized tanks of mineral oil, through which trillions of neutrinos pass unobstructed each second. But occasionally a neutrino hits the nucleus of a hydrogen atom, annihilating a proton and leaving behind a positron and a neutron”which will register a signal.
An enormous neutrino detector may prove useful for global monitoring, says Lindley Winslow, a neutrino physicist at MIT. A mega-detector called Juno is planned to start up in China in 2020, although that's primarily aimed at answering fundamental questions about the nature of the universe. The difference between neutrinos and antineutrinos may hold the answer to why the universe produced more matter than antimatter, allowing the world to exist.

