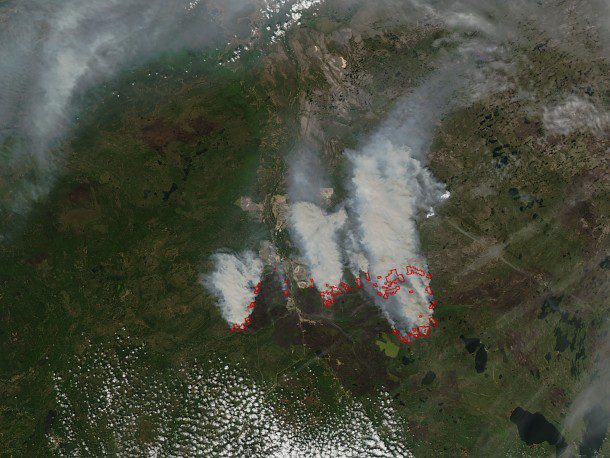
On May 24, the Moderate Resolution Imaging Spectroradiometer (MODIS) on NASA's Aqua satellite captured a natural-color image of fires that continued to burn. Red outlines indicate hot spots where MODIS detected warm surface temperatures associated with fires. (Credit: NASA image by Jeff Schmaltz, LANCE/EOSDIS Rapid Response)
The Fort McMurray wildfire, which was first reported on May 1, 2016, and not declared under control until July 5, 2016, destroyed more than 2,400 homes and buildings and forced the evacuation of 80,000 people in Alberta, Canada. Although no one died directly from the fire, it is expected to be one of the most-expensive natural disasters in Canada's history, with insurance and firefighting costs expected to reach up to $5 billion, a figure large enough to negatively impact the country's overall economy.
The fire burned approximately 600,000 hectares (an area larger than Rhode Island), and more than 1,200 wildland firefighters, 50 helicopters and 180 pieces of heavy equipment were used to battle the blaze.
There can be bigger fires, but, in Alberta at least, rarely are they so close to so many people, noted Robert Field, a Columbia University scientist based at NASA's Goddard Institute for Space Studies.
Satellite observations first noticed the precursors to the fire, including unusual heat, gusty winds and rainfall totals well below normal. Intense heat coincided with a weather pattern called an omega block, where a large area of high pressure stalled the usual progression of storms from west to east. In Alberta, that left sinking, hot air parked over the region while the block was in place.
As the fire spread and wreaked havoc on Fort McMurray, an ubran service area that supports many workers in the nearby Athabasca oil sands, satellites began collecting a wealth of data and images of varying stages of the fire's growth.
Watch a powerful video of residents escaping the fire and ash at https://youtu.be/HrpKew5kgvA.

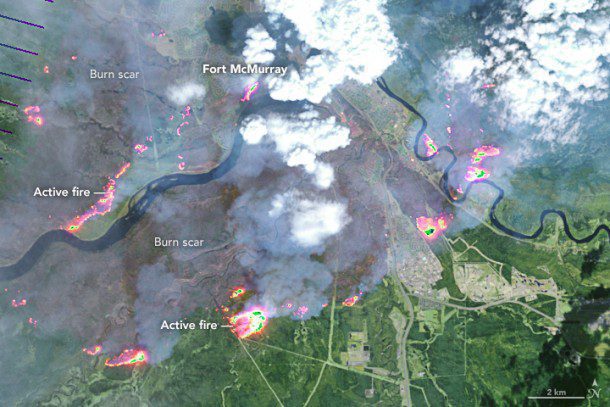
An image acquired by the Enhanced Thematic Mapper Plus on the Landsat 7 satellite shows Fort McMurray on May 4, 2016. On this day, the fire spanned about 100 square kilometers; by the morning of May 5, it spanned about 850 square kilometers; the fire eventually burned almost 6,000 square kilometers. (Credit: NASA)

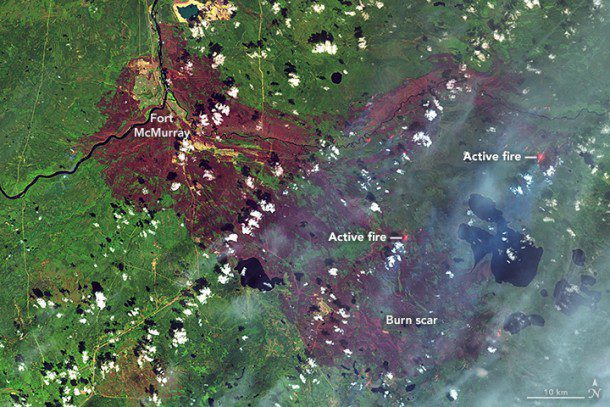
The Operational Land Imager on Landsat 8 acquired this false-color image of the burn scar on May 12. Infrared bands can penetrate clouds and smoke to reveal hotspots associated with active fires (red). (Credit: NASA Earth Observatory image by Joshua Stevens, using Landsat data from USGS)

