 By Matteo Luccio
Building on the practice of precision agriculture and exploiting recent computer advances, the Chesapeake Conservancy (CC) is developing open-source geoprocessing and analysis tools that help environmental nonprofits and local-government agencies prioritize conservation and restoration decision making. From creating new, high-resolution land-cover data and flow-path analyses based on LiDAR elevation data to developing custom Web applications, it's giving partners with little or no expertise in GIS or complex modeling access to large-scale data and modeling produced by state and federal agencies as well as larger non-governmental organizations (NGOs).
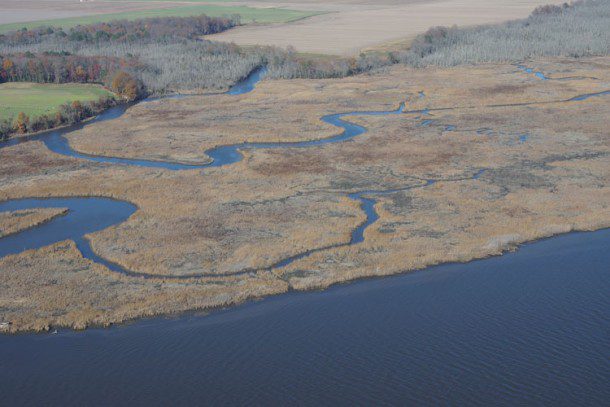
The CC is trying to identify naturally high-functioning landscapes, such as forest and wetland complexes, that provide water-quality benefits, habitat connectivity and often climate resilience. In doing so, it has likely created the largest, high-resolution land-cover dataset ever, which has also proved useful in urban and suburban areas. For example, it's helping the District of Columbia calculate the effectiveness of its green infrastructure projects and make tree-management decisions (see Tree Planting and Monitoring in D.C. below).
The Chesapeake Conservancy's Role
Prior to joining the CC, Jeffrey Allenby, director of Conservation Technology for the organization, managed a climate-adaptation grant program for the Maryland Department of Natural Resources. He now manages a team of nine people focused on projects ranging from creating new high-resolution land-cover data based on LiDAR elevation data to developing custom Web-based solutions for small land trusts and conservation organizations.
We can do a lot to simplify the process of them getting the information, while retaining the intricacy and details of the information and models, notes Allenby.

A LiDAR-based viewshed analysis illustrates the importance of the landscape for visually screening development to help managers protect the viewshed of George Washington's Mount Vernon.
Early in this endeavor, the CC began to see that its partners were very interested in getting custom-built software that would help them with their daily challenges, and the organization received a couple of grants to work directly with partners, understand their challenges and design custom solutions to help address them. We are also starting to see people coming to us without having support from a grant, notes Allenby. We've built a bit of a reputation for building easy-to-use tools.
Software Tools
All of the land-cover data that the CC is producing will be open source, so anyone can download and incorporate them into a GIS. Allenby's team does much of its work in Esri's ArcGIS desktop with the Spatial Analyst and 3D Analyst extensions, but they also use a variety of additional software packages: Harris Geospatial Solutions' ENVI for image analysis and feature extraction, White Box for hydrology modeling, and TauDEM, an open-source toolset developed by David Tarboton at Utah State University, for surface-flow direction modeling.
Allenby's team is building JavaScript- and HTML-based Web applications that customize commercial GIS and remote-sensing software packages. One such application helps George Washington's Mt. Vernon estate maintain a natural viewshed across the Potomac River. It enables staff to click on a parcel boundary or draw a building footprint, put in the proposed height of a new building, and see what its visual impact would be on the estate's viewshed.
 mapping can be used to better understand how certain landscapes impact water quality and can help direct conservation and restoration projects to areas where they will create the greatest benefits.")
Normalized Difference Flow Index (NDFI) mapping can be used to better understand how certain landscapes impact water quality and can help direct conservation and restoration projects to areas where they will create the greatest benefits.
The team has built other tools working with small land trusts that have no internal GIS capacity. If they have a new potential conservation easement or a landowner turns over to them a property for conservation, they have to evaluate it on several criteria to make sure it would be an effective use of their limited funding. Previously, it would take them about a week to call several different state agencies or other partners to get basic information”such as whether it contained any historical resources or was in the floodplain”and have people make maps for them.
We are able to summarize that information for all the parcels across the nine counties in which that land trust works, says Allenby. So now they can just go to a Web map and search by that parcel ID or click on a map, see all the information displayed right there, and export a report.
For feature extraction, Allenby's team uses mostly ENVI's rule-based feature-extraction workflow, which runs image segmentation. A custom rule set it developed enables the team to pull out from those segments one of seven different land-cover classes: water, barren, low vegetation, scrub shrub, forest, impervious structures and wetlands.
We are pulling that from the full LiDAR point-cloud data to create a normalized digital surface model that is comparing the maximum of the first returns of the LiDAR to the bare-Earth digital elevation model to get a canopy height in forest or a building height in terms of the structures and impervious surfaces, explains Allenby.
As its base dataset, Allenby's team uses the National Agricultural Imagery Program (NAIP), mainly because it's publically available.
We came at this problem from the point of view of a small, resource-limited nonprofit, and we didn't want to use up the entire budget buying expensive commercial imagery, notes Allenby.
NAIP imagery, which is collected on average every two to three years, has one-meter resolution and four bands; the CC's software can calculate NDVI as a fifth band and the normalized digital surface model as a sixth. This provides all the information we need to get a high-accuracy classification.
Luckily for the CC, a partnership between the U.S. Geological Survey and the relevant states already collected a lot of LiDAR data in the Chesapeake, including full, statewide coverage in Pennsylvania, Maryland and Delaware as well as coverage in coastal Virginia and some portions of New York.
LiDAR data improve the accuracy in many similar classes, such as structures vs. flat impervious, but our process does not necessarily require it, notes Allenby.
The CC currently is creating the baseline for the land-cover data, with funding from the National Park Service and the Chesapeake Bay Program, a state-federal partnership tasked with managing the Chesapeake Bay's water quality.
We are in discussions as to what the proper refresh rate is for that land-cover data, says Allenby. We are talking about re-doing it at the soonest in another two years and at the latest”or, perhaps, more realistically”every four to five years, when enough change occurs that it makes sense for the expense.
 with the Chesapeake Conservancy's one-meter data (bottom) demonstrates the importance of high-resolution data for decision making and modeling landscapes at the parcel scale.")
Comparing 30-meter land-cover data (top) with the Chesapeake Conservancy's one-meter data (bottom) demonstrates the importance of high-resolution data for decision making and modeling landscapes at the parcel scale.
Allenby's team tries to use planimetric data whenever available, because they yield a superior product than image segmentation. After completing the land-cover data, the Chesapeake Bay Program will take zoning and other information from localities and transform it from a 10-class land-cover classification to a 25-class land-use land cover”for example, separating out turf grass, pasture, crop and commercial areas from residential ones.
The CC is involved in a project being run by the U.S. Environmental Protection Agency and American University to perform a low-cost nutrient water-quality sensor challenge to bring the cost of a regulatory-quality sensor down under $5,000 from the current range of $20,000-$25,000.
As we start to look at our work in prioritizing and measuring the effectiveness of our conservation and restoration work, it is really going to be important to do that measurement, adds Allenby.
Identifying Priorities
On the conservation side, we are trying to identify those naturally high-functioning landscapes, such as forest and wetland complexes, that are providing water-quality benefits, habitat connectivity and often climate resilience, notes Allenby.
In suburban areas, the CC is working with some counties to identify opportunities for stormwater retrofits to reduce the amount of stormwater entering storm drains or getting into creeks and help them achieve watershed-implementation goals.
It is trying to get a better understanding of how the landscape is functioning and then prioritizing projects in the places where it makes the most sense to maximize the benefits, minimize the cost and minimize the impact to society at large, adds Allenby.
The CC has checked riparian buffer coverage for completeness throughout the James River watershed in Virginia”about 10,000 square miles, from the Norfolk-Hampton Roads area all the way to the Virginia-West Virginia border”and all 100-foot buffers around National Hydrographic Dataset streams. It calculated all the natural buffers, which it classified as either forest or wetlands, and it's now working with the James River Association”a large, well-established watershed organization that manages river keepers and does a lot of on-the-ground restoration and outreach work”to identify four soil and water conservation districts in the areas with the lowest buffer percentages. The CC then was able to get funding to work with those districts to perform the on-the-ground restoration work and riparian tree planting as well as cattle exclusion along the rivers.
We are doing the initial outreach meetings with the soil and water conservation districts with the James River Association right now and, over the next three years, we will be working on identifying willing landowners who want to allow this restoration work to occur on their land, adds Allenby. We have the funding to make it cost-effective for them, so the land owners don't have to bear any of those costs, and we are able to focus our restoration efforts on the watersheds where we have the most distance to go in terms of buffer-restoration work.
A Revolution in Land-Use Management
Over the last five years, says Allenby, the decrease in the cost of storage, RAM and computer processing power has opened up the capability of working with massive datasets. Right now, we are in the process of exploring the potential of moving our workflow up to a cloud-based platform, which will open things up to a whole other level.
When he was doing the initial research for this project, professors and established practitioners told him it wouldn't be feasible to use high-resolution imagery everywhere. Instead, they told him, he should use moderate-resolution land-cover imagery, such as Landsat or the National Land Cover Database, to perform his analysis for an entire watershed and find hot spots, then use high-resolution imagery on small areas. However, the CC challenged that conventional wisdom.
We found that it is feasible, and the price and human power it takes are a lot lower than it used to be, so it has really allowed us to push the boundary of what's feasible, notes Allenby.
I am fairly confident in saying that this is probably the largest, high-resolution land-cover dataset that has ever been created, he states. It will end up being about 67,000 square miles when we are done with it in May [2016]. It is really exciting to be at the forefront of this. It is going to fuel a revolution in the way the landscape is modeled and managed.
Allenby is very excited about the future of this project.
Over the next six months, as the land-cover data are finished up, and over the next year, as people start to use it, it is going to change the way that land conservation and restoration is going to be done and prioritized in the Chesapeake and, hopefully, beyond, he says. It is going to catapult the role that technology plays within the conservation and restoration movement. It is going to make us more sophisticated and, hopefully, lead an improvement in water quality and the health of the Chesapeake Bay.
Tree Planting and Monitoring in D.C.
In addition to their work to create a conservation database, the Chesapeake Conservancy (CC) team is developing a series of Web-based tools to help the District of Columbia's Urban Forestry Administration decide where to plant trees on public lands by analyzing such elements as areas where surface water accumulates.
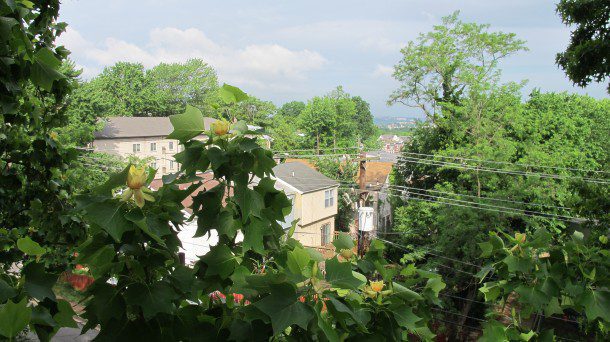
An aerial view of Washington, D.C., taken through the crown of a tulip poplar, looks toward the Anacostia River and the downtown area.
These are areas where we can make big differences in the quantity and quality of the water that is leaving these properties with some targeted tree planting, says Earl Eutsler, acting associate director for Urban Forestry in the Urban Forestry Administration of the Department of Transportation of the District of Columbia.
The same tools also can be applied to private parcels, and they will help the agency calculate the effectiveness of each green infrastructure project. Initially founded to care for the city's street trees, the agency expanded its mission to also regulate the removal of trees on private property.
In his 12 years with the agency, Eutsler has helped grow it. We have a team of 20 dedicated arborists, two landscape architects, a field crew and staff assistants, and we are able to do more with the people and resources that we have thanks in large part to a wide range of innovations over the years that made us more efficient and effective.
In particular, Eutsler has been focused on increasing the volume of services that his team provides, such as planting more trees every year than it did the previous year, while maintaining or increasing the quality of what they're planting. To do this, they rely on technology to track and analyze the efficacy of their program.
About eight years ago, the team moved from a paper-based inventory to a full GIS, allowing them to rigorously track all their trees and every one of the 300-500 interactions that their arborists have with trees on any given day.
Occasionally, people removed trees from private property without a permit and, even if caught, they could get away with the crime, because permit fees and fines are based on measuring the trunk at 4-feet 6-inches above grade. In 2014, his team began to use LiDAR data and tree-feature extraction software to estimate tree populations on public lands that were not in any inventory and calculate the benefit they provide.

A screenshot shows the software used to track tree management in the Washington, D.C., area.
In one example, they came across a site where someone had cleared a couple of lots of mature trees. Using the diameter of the tree stumps, their elevation from the ground, the reference data they had created using LiDAR, and standard taper equations used in forestry to estimate the amount of timber in an acre of land, they were able to estimate the diameter of trees that had been removed and fine the developer who had removed them $100,000.
We've used this approach on multiple properties since, notes Eutsler. Whenever we come across a tree that has gone missing, we use the same approach to reference the point cloud to understand how tall the tree was, and then we build a model that allows us to plug in the other attributes”stump diameter, the stump's height above grade”and calculate the diameter at 4-feet 6-inches above grade. It's been a real sea change in terms of administering a law that requires people to opt in.
Eutsler's team has been expanding the focus of these efforts to understanding which trees have done the best as well as the social dynamics that influence tree establishment, success and growth.
The idea is to identify where conservation efforts”tree planting and other elements of green infrastructure”can be applied such that they'll have the greatest impact on water quality, stormwater mitigation and things of that nature, he notes. We are working on a series of high-quality land-cover analysis tools that help us optimize our decision making.
Matteo Luccio is a freelance writer with Pale Blue Dot, specializing in geospatial technologies; e-mail: [email protected].
