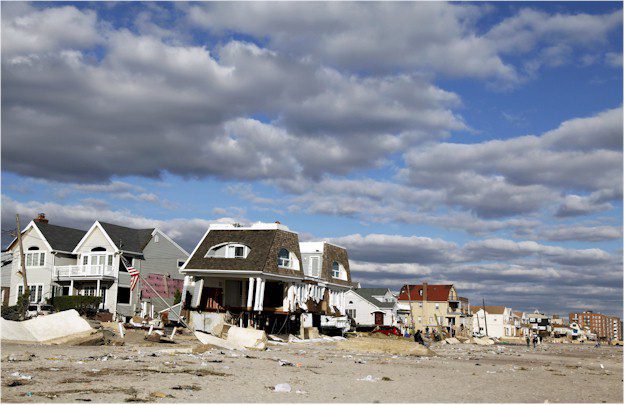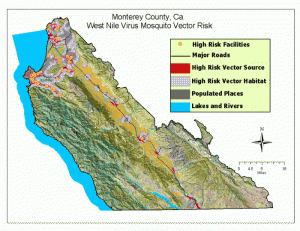
From delivering critical DEMs for storm surge predictions during Superstorm Sandy (above) to mapping mosquito breeding areas (below), Intergraph's Geospatial Portfolio meets every geospatial need.
Geospatial information is increasingly being used to drive critical decisions in government agencies of all sizes. In times of humanitarian crisis or disaster response, when it's critical for federal agencies to collaborate with state and local governments, geospatial information can enhance many key activities.
Two key examples are predicting storm surge impacts and stopping the spread of insect-borne illnesses like West Nile Virus. To help address these problems, two local government agencies used Intergraph products to harness the power of geospatial information.
The ability to digitally describe and understand the real world with faster tools that measure accurately and provide more frequent and real-time updates opens new doors for Intergraph customers. Working with the city of Virginia Beach, Va., and ERDAS IMAGINE remote sensing analysis software, Intergraph delivered critical digital elevation models (DEMs) for storm surge predictions during Superstorm Sandy in less than 24 hours and within six inches of accuracy.
Information delivered via Intergraph's ERDAS APOLLO data management solution created DEMs that Virginia Beach used to immediately target specific evacuation areas. City of Virginia Beach GIS Coordinator Rob Jessen spoke of the city's increased abilities during Sandy.
We have a peninsula nearby that we didn't evacuate because we were predicting the hit would be minor, and we were correct, said Jessen. Being able to precisely predict impacts when a storm is coming, and only use the [Virginia Beach] alert system where and when it's absolutely necessary, has improved the response rates. The feedback we've received has been so positive that we've expanded the alert beyond land lines to cell phones, and residents can register for alerts at home and work locations.
Natural flooding disasters aren't the only areas of relevance for Intergraph's Geospatial Portfolio. The products are adaptable to nearly any situation where geographic data can be useful.

Student researchers successfully classified vegetation and urban areas to identify potential mosquito habitats using ERDAS IMAGINE.
For example, to combat West Nile Virus, student researchers for the health department of Monterey County, Calif., successfully classified vegetation and urban areas to identify potential mosquito habitats using ERDAS IMAGINE. The vegetation classification was put into a vector coverage to integrate with other data layers within an Esri ArcGIS environment.
The students conducted overlay analysis to produce three specific layers that targeted the problem. The layers mapped mosquito breeding source areas, adult mosquito habitat areas, and high-risk mosquito source and habitat areas. The project's final risk map, shown at left, depicts high-risk areas in red. These are mosquito breeding areas that are located close to densely populated areas, including hospitals, retirement centers and horse facilities.
The final outputs of this project have helped identify at-risk communities, enhance virus planning and prevention planning, and help land developers seeking building permits become aware of what areas are more at risk, said Darryl Tyler, a GIS analyst at the Monterey County IT Department. These maps are also helping influence virus policy and management decision makers.
More than ever before, we can sense the real world around us”from space, the air and the ground. With advances in technology, we can also make sense of captured data with clever algorithms for data fusion, feature extraction and integration with business intelligence. Intergraph's Geospatial Portfolio harnesses the power of technology to create a dynamic GIS environment. Offering the powerful ERDAS product line, the popular GeoMedia suite and a plethora of other capabilities, the company's latest portfolio provides an array of products to meet every geospatial need.


