Image processing innovations are creating value for decision makers.
By Robert Schowengerdt, professor emeritus, University of Arizona (http://www.arizona.edu/), Tucson, Ariz. He is the author of Remote Sensing”Models and Methods for Image Processing (2006), which is now in its third edition and available at http://www.elsevier.com/.
Remote sensing science and technology have evolved dramatically in the nearly 40 years since the launch of the first Landsat Multispectral Scanner System in 1972. A growing global industry now acquires, processes and analyzes remote sensing data from a diverse array of sensors, including optical, radar and laser technologies. High spatial resolution imagery is available commercially to the public and compete with airborne sensor imagery for many mapping applications.
Technology Trends
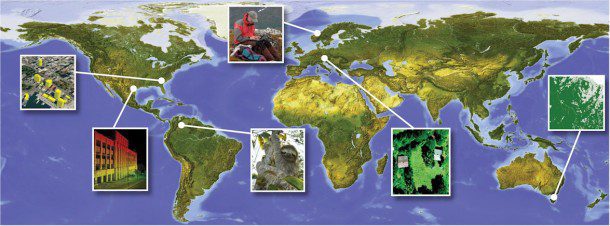
This section of Earth Imaging Journal highlights the current capabilities of the remote sensing industry and the applications that are possible with these capabilities and the software used to take advantage of them. The case studies presented here exhibit several underlying geospatial technology trends:
- High-resolution (1 meter or less) pointable satellite sensors enable detailed analysis and repetitive stereo views.
- Light detection and ranging (LiDAR) technology enable precise direct terrain elevation measurement over relatively large areas.
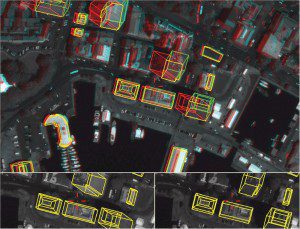
- Digital photogrammetry enables 3-D object analysis (e.g., of buildings).
- Integrated raster and vector software tools enable remote sensing data inclusion in geographic information system (GIS) datasets.
We may think of these technologies as application enablers. For example, pointable satellite sensors enable repetitive views of a given ground area. A stereo pair may be acquired in-track in sequential frames or cross-track from adjacent orbits because of the pointing capability. Even multilook views of the same area are possible within a relatively short time period. Coupled with the development of high-resolution sensor arrays, myriad applications of 3-D photogrammetry, GIS and visualization have made great advances using satellite imagery.
LiDAR is also in the sensor domain. LiDAR sensors are scanning lasers, typically airborne and relatively low power, which scan a swath of ground along the path of an airplane. By analyzing the reflected power point cloud, it's possible to determine the terrain elevation below the airplane and the 3-D shape of objects on the ground, such as vehicles, buildings, etc. The development of high-speed electronics and sensor systems, coupled with the Global Positioning System (GPS) and new software algorithms, have pushed this technology toward new applications that weren't possible a couple of decades ago.
Digital photogrammetry is perhaps the oldest of the four enabling technologies, dating back to the 1960s. However, rapid strides have been made in the last 10 years or so, with vastly increased computing capacity and software development. Another major motivator has been the increasing availability of high-resolution digital elevation model data over large areas, such as the data collected by the NASA-led Shuttle Radar Topography Mission in 2000. And, of course, GPS has had a profound impact on digital photogrammetry”just as it has on many other technologies.
Finally, integrated raster and vector software tools have come to fruition in several commercial off-the-shelf software systems, both on the image processing side and on the GIS side. Historically, these two segments were developed and largely used separately. Thus, GIS practitioners found it difficult to incorporate new remote sensing imagery and products, such as classification maps, into their GIS databases. With the improved integration and cross-collaboration between imagery and GIS technology, one of the most useful benefits of remote sensing is finally being realized in the continued updating and enhancing of spatial datasets.
Many of these enabling technologies cross-link to each other. Indeed, innovation in remote sensing data analysis often has been driven by the availability of new types of data at ever-increasing resolution, which in turn is motivated by analysts' needs. Perhaps sensor technologies lead the way for the whole geospatial community and will continue to do so for many years.
Infrastructure Mapping
LiDAR Innovations Bolster Project Success
Historically, photogrammetry has depended on aerial photography to extract information. Now a wider range of tools offers advantages over conventional methods. For example, by using light detection and ranging (LiDAR) data, Cardinal Systems (http://www.cardinalsystems.com/) has expanded the data types available to photogrammetrists with its new VrLiDAR module, which allows for a greater range of deliverables and creates an environment that simplifies the fusion of multiple data collection platforms.
Unlike traditional photogrammetry, a point cloud viewed in 3-D stereo allows us to analyze the data from multiple perspectives, relates Cardinal Systems' client Brian Falls, vice president of Business Development at Aerial Data Service Inc. The ability to collect features from a true 3-D point cloud increases the overall accuracy of our deliverables.
LiDAR Benefits
LiDAR datasets are changing how firms approach geospatial projects, benefitting terrestrial, aerial and mobile mapping applications. Recent improvements have been made that specifically cater to each market. For example, data acquisition at highway speeds and increased safety for surveyors and the travelling public have heightened the popularity of mobile mapping systems. As terrestrial scanning applications are diversifying relative to decreasing hardware prices, indoor and close-range scanning projects are becoming standard. VrLiDAR's ability to display measured point data by intensity, RGB and classification strengthens the intelligence of point cloud data.
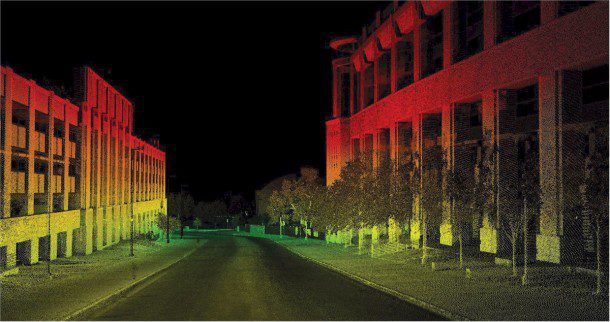
Mapping professionals now take advantage of 3-D vector data from traditional sources, such as aerial and close-range photography, as well as LiDAR point data from aerial and mobile mapping systems.
Important features in Cardinal Systems' 3-D ViewPoint environment include Cursor Draping, in which the cursor may be draped, real time, over any LiDAR surface. According to Falls, this improves productivity by reducing collection times and helping analysts accurately discern the surface.
LiDAR data consist of points that define multiple planes, objects and surfaces within the cloud, making features such as Z slicing and near and far clip limits important tools. With support for up to 16 attributes per point, data can be displayed and filtered based on multiple user specifications. Applications such as classify by cube, cylinder fit, cursor classification and Z modification are coming to the forefront as development continues to adapt to customers' needs.
In today's economy, it's vital to deliver a better product in less time under tighter budget constraints. Using methodologies to efficiently extract a point cloud's intelligence is critical for a successful project. With efficient software and training, 3-D stereo data capture from LiDAR can cut production times dramatically. Although LiDAR technology has been around for years, recent hardware advances have harnessed the size of point cloud datasets, allowing software programs like VrLiDAR to exploit the intelligence within each LiDAR pulse.
Species Distribution Analysis
Modeling Technique Supports Conservation Efforts
Species distribution modeling presents great potential in conservation planning efforts, as it can be the basis for determining conservation sites, generating corridors or calculating biodiversity measures.
When modeling habitat suitability and species distribution, theoretical models are based on a priori knowledge of the species' niche or an organism's physiological requirements. Conversely, empirical models don't need habitat information, as they relate actual observations of the organism (training data) to a set of environmental conditions (environ-mental variable data) through a model.
Modeling Algorithm
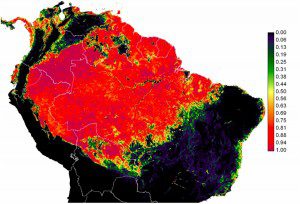
The Mahalanobis Typicality modeling approach used within the IDRISI geographic information system and image processing software, developed by Clark Labs (http://www.clarklabs.org/), assumes a normal underlying species distribution with respect to environmental gradients. The approach's output is a typicality probabilities map, with values ranging from zero to one, which expresses how typical the pixel is of the examples on which it was trained.
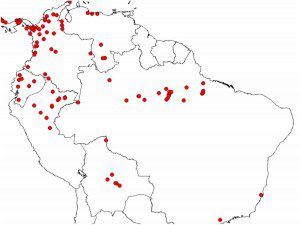
Figure 1. Presence data included samples of locations where the brown-throated sloth is known to exist.
Thus, a value of one would indicate a location with environmental conditions identical to the mean of environmental conditions in the training data. Values approach zero as conditions become more dissimilar to the observed mean. Any value greater than zero has some degree of similarity to the training data.
Modeling in Action
The brown-throated sloth (Bradypus variegatus) is an arboreal species inhabiting Central America and Northern and Central South America. Because of its wide distribution and presumably large population (Figure 1), the International Union for Conservation of Nature (http://www.iucn.org/) reports this species as one of least concern. Clark Labs researchers modeled the species' distribution through the Mahalanobis Typicality algorithm using species observations obtained from the Global Biodiversity Information Facility (http://www.gbif.org/). In addition, several variables were considered: annual mean temperature; temperature annual range; mean temperature of the coldest month, derived from MODIS land surface temperature; and elevation, derived from the Shuttle Radar Topography Mission.
The output typicality image (Figure 2) represents how typical the environmental conditions are at any pixel to the environmental conditions found at the sample points in the training data. A threshold can be used to specify which typicality values will be considered part of the species range. Researchers used a threshold of a typicality of 0.5 to generate B. variegatus' geographic range”only pixels with typicalities greater than 0.5 are part of the geographic range. The resulting output range map (Figure 3) predicts the species to be present north of the Amazon and east of the Rio Negro.
However, B.variegatus doesn't inhabit these regions. Although all locations inside the predicted range have suitable environmental conditions to host the species, not all of them are part of its realized niche. Indeed, these locations correspond to another species of sloth, the Bradypus tridactilus, with a range that doesn't overlap that of B. variegatus.
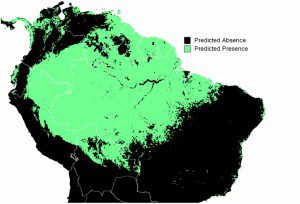
Figure 3. The predicted range map may show suitable environmental conditions to host the species, but it may not show its realized niche.
The species' fundamental niche represents the full range of environmental conditions under which the species can exist. However, pressure for species interactions may cause species to occupy just one portion of their fundamental niche. This smaller range is called realized niche.
Therefore, the predicted geographic range produced here represents the potential or fundamental species niche, not the realized niche. Factors such as competition with the other species of sloth may be constraining the species to occupy only part of the fundamental niche. Therefore, caution must be used when interpreting the modeled geographic range.
3-D Analysis
Create 3-D Geoinformation from Satellite Sensors
The notion of 3-D geographic information system (GIS) technology has been gaining momentum in the geospatial industry for years. Now the convergence of GIS, photogrammetry and remote sensing data, tools and methods has matured to make integrated 3-D GIS applications a reality.
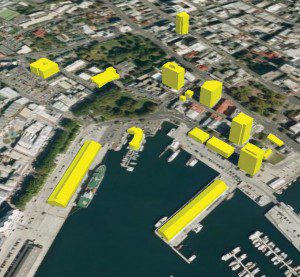
Stereo imagery has been a primary source of 3-D geospatial data products since the advent of digital photogrammetry. Now such imagery is used to create digital orthophotos, terrain models and 3-D vector data. Although orthorectified imagery is used as a base layer in many GIS applications, the additional 3-D vector and terrain information allows for analysis that goes beyond traditional 2-D geospatial applications.
Satellite data providers are at the forefront of creating products derived from stereo imagery. A workflow for producing the aforementioned data products in a softcopy photogrammetry environment was documented during ERDAS acceptance testing of GeoEye's GeoEye-1 sensor model implementation. Launched in September 2008, GeoEye-1 is one of the highest-resolution commercial imaging satellites, with panchromatic (0.41-meter resolution) and multispectral (1.65-meter resolution) sensors. The same workflow also could be applied to DigitalGlobe's WorldView-1 panchromatic sensor, which was launched in September 2007 and features 0.5-meter resolution at nadir. Although satellite imagery is often lower in resolution than airborne imagery, it offers an advantage in area that can be covered by a single image. Working with fewer images allows faster processing of certain steps of the workflow.
Workflow Overview
The workflow described here is for an urban project area with ground control points. The availability of accurate ground control means sub-meter accuracy can be achieved. However, even without ground control it's possible to create relative stereo pairs that will have comparable accuracy to the original images. This can be beneficial for remote area mapping and can dramatically reduce costs when meter-level accuracy is sufficient for project requirements.
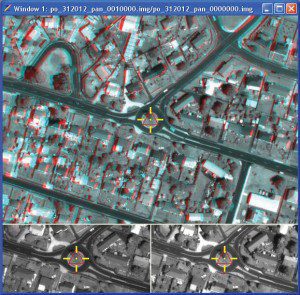
A softcopy photogrammetry system can be used to derive geoinformation products from stereo imagery. LPS from ERDAS (www.erdas.com) can ingest and process the imagery in a straightforward workflow that involves setting up the project, measuring ground control points, performing automatic point measurement, performing and refining the triangulation, generating and editing terrain and performing orthorectification. Users can perform 3-D feature extraction anytime after the triangulation.
Step-by-Step Instructions
Project setup involves selecting the geometric model (GeoEye RPC/WorldView RPC) and then adding the images in LPS Project Manager. At this point, processes like image pyramid generation also can be performed.
After the block is set up, the next step is to use point measurement in either stereo or mono mode to measure the ground control points. This is where file/pixel coordinates are related to real-world XYZ coordinates from surveyed ground control points. Typically this can be a time-consuming step, but LPS has an automatic XY drive capability that puts the operator in the approximate area when he or she is ready to measure a point. After the ground control points are measured, automatic tie point
measurement can be run to generate tie points, which may be necessary if there's insufficient ground control to solve the triangulation. If ground control points aren't available, automatic tie points are required to create a relative stereo pair. Users have full control over the tie point pattern so there's a high degree of flexibility based on the project requirements.
After generating tie points, bundle adjustment can be performed in LPS Core. This process involves running an adjustment, reviewing the results, refining if necessary and accepting the results once they're suitable. This is a critical step, because after triangulation, the initial data product has been generated: a stereo pair. Stereo pairs are crucial for 3-D product generation, because XYZ measurements can be made from them; then 3-D terrain products and vector layers can be generated.
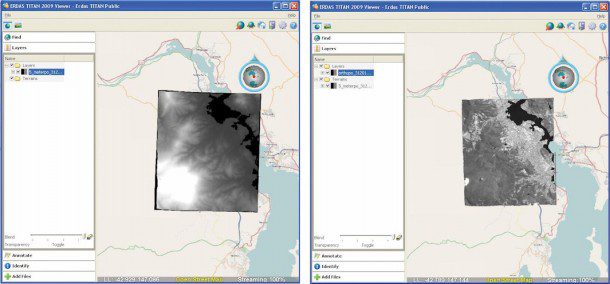
The next step is to generate a terrain layer that can be used as a source during orthorectification. The Automatic Terrain Extraction tool in LPS can generate a surface and allow a high degree of control regarding post spacing, filtering, smoothing and more. In this workflow, a 5-meter grid was generated, as shown in the bottom-left image.
After performing terrain editing with the LPS Terrain Editor to create a bare earth digital elevation model, an ortho-photo was created from a 0.5-meter panchromatic GeoEye image. Terrain editing is important because errors in the terrain can introduce horizontal error into orthophotos. The orthophoto is displayed in the bottom-right image.
Carbon Assessment
SAR, Optical Image Analysis Assesses Forest Change
Geospatial imagery provides specific information about geographic areas of interest and is used to make informed, accurate decisions in a variety of applications. One popular application is environmental conservation and resource management. Many local, national and global environmental and conservation programs have begun to take advantage of increasingly available geospatial imagery to address problems ranging from monitoring the effects of pollution to identifying optimal locations for planting trees.
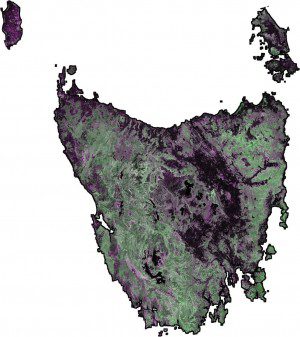
An image of Tasmania from Japan's Advanced Land Observing Satellite (ALOS) PALSAR sensor was orthorectified, radiometrically calibrated and mosaicked using SARscape.
In the last few decades, leaders from countries around the world started working together to tackle global environmental issues. One of the main goals is reducing greenhouse gases”and ultimately global warming. One way they're attempting to reduce emissions of greenhouse gases is from restricting deforestation and forest degradation.
To address the challenge of measuring and monitoring ecosystems and land use changes, the Group on Earth Observation (GEO) Forest Carbon Tracking Task (FCT) was established. Now, with close to 80 governments and 56 leading international organizations in its partnership, GEO FCT (www.geo-fct.org) aims to demonstrate the feasibility of coordinated Earth observation to monitor forests and collect information to serve as input to future national forest and carbon monitoring systems.
Dr. Anthea Mitchell, visiting research fellow in the Cooperative Research Centre for Spatial Information at Australia's University of New South Wales, is one of several individuals around the world tasked by GEO FCT with creating standardized methods for processing data and imagery and generating forest information products for use in carbon assessment. Ultimately, Mitchell is working to develop image analysis routines that can be used worldwide to measure, monitor and report forest change.
A SAR Solution
One of Mitchell's primary methods for monitoring forest change is using important data from optical and Synthetic Aperture Radar (SAR) imagery. The differences between these types of imagery make them complement each other. SAR sensors emit their own illumination source in the form of microwaves, which allow them to record data at all times of day and all weather conditions. SAR technology uses different wavelengths than optical sensors, allowing it to record data through atmospheric interference like clouds and storms. These wavelengths, combined with the fact that SAR is a side-looking sensor compared with optical sensors that mainly look straight down, mean that terrain and cultural targets respond uniquely to radar.
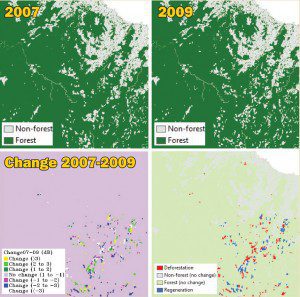
To evaluate forest extent and land cover/land use change using ALOS PALSAR data, ENVI's change detection tool can detect brightness (backscatter) variations between dates that can be related to on-ground change. A decrease in brightness may indicate clearing of forest for plantation, while an increase may indicate regeneration of forest or a change in soil/canopy moisture.
Because SAR scans Earth differently than optical sensors, the technology gives Mitchell a unique layer of contextual information about specific geographic areas of interest. According to Mitchell, SAR is unique in that it provides information about 3-D structure and moisture content of items on Earth's surface and is useful for discriminating and mapping different forest types and biomass.
To effectively use the SAR data Mitchell is given as part of GEO FCT, she needed a solution that could effectively process and analyze SAR data and easily work with optical imagery. After evaluating her options, she ultimately chose SARscape Modules for ENVI from ITT Visual Information Solutions (http://www.ittvis.com/). SARscape has unique capabilities to read, process, analyze and output information from SAR data and imagery. SARscape converts data from hard-to-interpret numbers to meaningful, contextual information. And, because SARscape is integrated with ENVI image processing and analysis software, users can take advantage of multiple types of imagery and exploit the critical information they contain.
To extract valuable information within SAR data, the data first must be read and processed. Because Mitchell is given SAR data from a variety of sources, it's critical that she has one software package that can accurately read the data in the correct format. SARscape streamlines the process of importing and reading SAR data from a variety of sensors.
After reading the SAR data, Mitchell uses SARscape to perform a variety of automated processing tasks to prepare the data for visualization and analysis. These tasks include multilooking, coregistration, despeckling, geocoding and radiometric calibration, as well as mosaicking. Because radar images typically have a lot of noise, Mitchell thoroughly filters them to minimize the noise. The coregistration process automatically superimposes images acquired over the same area on different dates. The data also are geometrically and radiometrically corrected, which is required to be able to analyze and compare images acquired at different times or by different sensors.
Once processed, the SAR data are analyzed with ENVI. Because SARscape is integrated with ENVI, Mitchell can perform advanced image analyses without leaving the software. She uses ENVI's change detection tool to detect and measure changes between the images. The automated workflow for detecting change in ENVI identifies the type and extent of changes that have taken place in an area over time. Using change detection, Mitchell looks for increases and decreases in brightness, which often signify forest areas that have been cleared or have regenerated. Because a brightness increase might also be a result of an increase in soil or canopy moisture, optical imagery is brought in to confirm the results.
SAR Success
Mitchell has had a lot of success achieving the GEO FCT objectives. She has been able to generate annual forest and nonforest extent and land cover maps and change maps that show deforestation and regeneration changes over time by processing and analyzing SAR and optical imagery in SARscape and ENVI. She has created standardized methods for processing and analyzing SAR data from different sensors and used the data to create forest information products for carbon assessment. In short, SAR data have provided Mitchell with critical information that she wouldn't be able to gather solely using optical imagery.
Satellite Data Analysis
Norwegian Geological Survey Analyzes ASTER Imagery in GIS
The Geological Survey of Norway (NGU) is responsible for deriving bedrock maps as a service to its Bedrock Mapping Unit. Bedrock maps are essential for exploring mineral and hydrocarbon deposits, evaluating groundwater resources and determining appropriate locations for highways, pipelines, waste disposal and heavy industrial sites. Bedrock maps also serve as the geological framework for environmental assessments, land use plans, forest inventory databases and similar applications.
Creating and updating bedrock information involves a process whereby field work is required to properly identify transition zones and rock types to create accurate maps. With such a large area to cover, NGU has been assessing the potential for using satellite remote sensing to create preliminary bedrock maps so scientists can spend time refining the information by visiting field locations where ambiguous results have been derived.
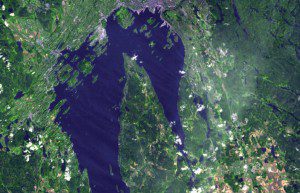
ASTER captures high spatial resolution data in 14 bands, from the visible to the thermal infrared wavelengths, and provides stereo viewing capability for digital elevation model creation.
The use of satellite imagery has been helpful, especially in geologic areas with little soil and vegetation coverage”that is, where there's an unobstructed view of the bedrock from space. To collect data for the identification of boundaries between bedrock units and structures in southwestern Norway's Rogaland Area, NGU selected imagery collected by the Advanced Spaceborne Thermal Emission and Reflection Radiometer (ASTER) sensor, which provides good spectral information”including thermal bands”while preserving good spatial resolution. The study area is heavily scoured by Pleistocene ice sheets and, as a result, is largely devoid of significant Quaternary soil cover, making it an ideal testing ground for bedrock mapping using satellite remote sensing.
A Raster Nightmare
Despite the potential high quality and value associated with the ASTER data, NGU found that upon receiving the imagery from the data provider, it was difficult to integrate the data into ArcGIS 10, a geographic information system (GIS) from Esri (www.esri.com). Adding the data directly didn't produce a good result because the imagery didn't line up with any of the reference vectors or other base maps in the GIS.
Before allocating internal resources to analyze the imagery, NGU had to ensure the newly collected imagery would be properly aligned with other base map information. NGU considered using an existing image processing package to correct the data, but hesitated doing so because learning how to use new software represented a significant time and cost commitment.
Geoimaging Tools
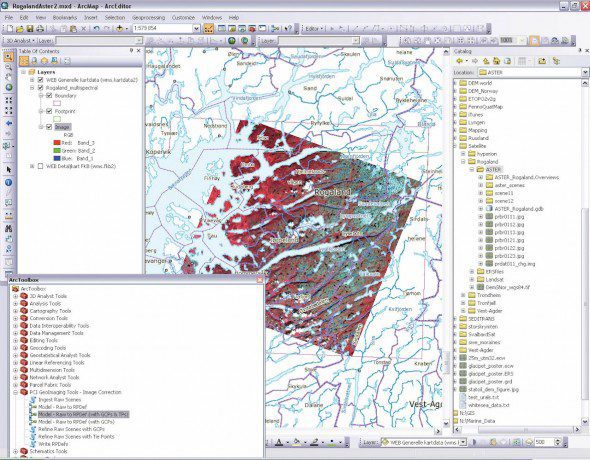
Just as NGU was getting ready to abandon the idea of using the ASTER imagery, Nils Erik Jørgensen from Terranor (www.terranor.no) contacted NGU to discuss new technology introduced by PCI Geomatics (www.pcigeomatics.com). NGU researchers were delighted to hear PCI had developed an extension to ArcGIS 10, as this meant there was the potential to implement a more streamlined workflow. In addition, learning how to use an external software package to correct the imagery would no longer be required, as PCI's GeoImaging Tools is integrated directly into ArcGIS.
Prior to integrating GeoImaging Tools into its environment, NGU staff evaluated the software to determine if the tools could solve the operational challenges with the ASTER data. Downloading a fully functional trial version of the software was straightforward. Within a few minutes, the software was downloaded and installed at NGU's office and integrated directly into ArcGIS.
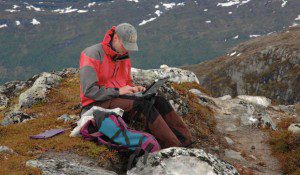
Dr. Ola Fredin updates preliminary ASTER-derived bedrock maps in the field using a ruggedized laptop and ArcGIS.
NGU evaluated correcting the imagery using the software's nominal model. GeoImaging Tools is based on PCI's Rational Polynomial Function (RPC) sensor model technology, which uses ephemeris information collected by satellites when images are captured, along with a digital elevation model to perform accurate corrections. NGU staff followed instructions from the software's user guide and within minutes produced a result that finally aligned with reference vectors and other base information.
Going one step further, in GeoImaging Tools' demonstration tutorial, NGU staff noticed that a series of SPOT images were corrected using a reference Landsat dataset over British Columbia, Canada. Global coverage is available from Landsat through the U.S. Geological Survey; therefore, NGU downloaded the overlapping tiles over the ASTER scene to use as a reference dataset from which to collect ground control points. The same process was executed using GeoImaging Tools, this time with the initial model refined using the reference Landsat dataset. GeoImaging tools includes automatic image-to-image matching technology, which collects reference points that are used to build an accurate model to correct the data. The end result was even better than the nominal correction. Finally, NGU was able to begin the work of leveraging the valuable information contained in the ASTER imagery.
Field Use
Having used GeoImaging Tools to correct the imagery directly within ArcGIS, NGU began the process of creating preliminary maps, outlining the boundaries and structures using ArcGIS feature editing functionality. These data, along with reference base maps and vector information, are loaded onto field-ready ruggedized laptops equipped with built-in Global Positioning System capability. From the field, NGU scientists can load the preliminary information derived from the ASTER imagery and prioritize field checks where ambiguous zones have been identified. The preliminary information is verified and updated, then synchronized back in the central database when scientists return from the field. This integrated approach saves time and money, complementing NGU's ability to leverage the valuable information that can be derived from satellite imagery.
Urban Planning
Automated Image Analysis Streamlines Large-Area Modeling
The cost and time associated with manually assembling and processing detailed image data is significant. Integrating 3-D data, such as the data generated by aerial laser scanning, vastly improves the value and accuracy of the information product produced. However, such data are practically impossible to manually prepare and analyze. Only by using software to automate data handling and analysis is it feasible for organizations to tackle land-use modeling and mapping projects for large areas.
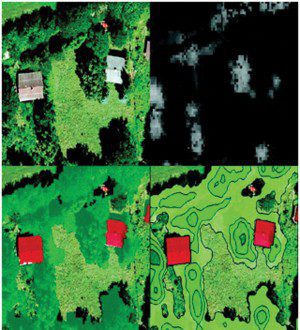
Stages of the GEOinfo project included (clockwise from upper left) RGB image generation, DSM development, basic land cover creation and generalized results analysis.
The Department of Surveying and Geo Information of the State Government of Lower Austria (GEOinfo) did exactly this when it adopted a process that could automatically analyze large volumes of data to deliver accurate and reproducible results in a standardized manner. Sound-wave propagation models for traffic noise have been generated over an area of more than 20,000 square kilometers in Austria using INPHO and eCognition software from Trimble (www.trimble.com). The project detects and quantifies changes in forests, buildings and water bodies using aerial laser scanning and orthophotos, and has been developed by the Government of Lower Austria as part of an urban planning initiative from the European Union. Topography and buildings affect noise propagation, so an accurate land-use model is essential for calculating noise pollution in a city. With measured accuracy ratings above 94 percent, the automated approach provides an information product that would be completely unviable and cost-prohibitive to create manually.
Handling Airborne Geospatial Data
In the GEOinfo project, automating photogrammetric processes and digital terrain model (DTM) generation was essential due in part to the large data volume. Project personnel used INPHO, a photogrammetry and digital terrain modeling software suite, to manage and process GEOinfo's aerial laser scanning data over large areas. The TopDM module was used to manage approximately 30,000 raw data flight strips, from which 20,000 DTM and 20,000 digital surface model (DSM) data tiles were derived. Various SCOP++ modules were applied to these datasets to perform tasks such as point cloud classification using filtering strategies, shade calculation, slope calculation, profile tools and other terrain algebra methods. Available breaklines were used during these processes to increase the quality of the terrain modeling, especially in challenging topographic areas. The output of these processes provides input data for the next workflow step: the production of value-added products using eCognition.
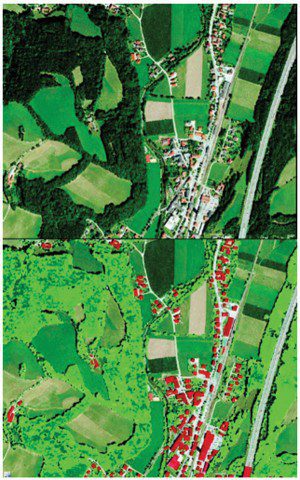
Using eCognition, GEOinfo staff took a map sheet sample (top) and created a corresponding classification result (bottom).
Detecting and Quantifying Changes
GEOinfo used eCognition image analysis software to detect and quantify changes in forests, buildings, fields and water areas from the DSMs, DTMs and orthophotos. Within eCognition, a variety of source data can be imported, fused and segmented to create meaningful objects using prescribed conditions such as average elevation and normalized difference vegetation index. The software identifies objects and makes contextual inferences, using the color, shape, texture and size of objects, as well as spatial relationships. This logic was applied to data representing 20,000 square kilometers of Lower Austria. To deal with this volume of data, a tiling and stitching technique was applied, creating 2,000- x 2000“pixel tiles, each representing 1 square kilometer of territory. Within each tile, eCognition automatically classified
elevated objects and distinguished buildings, trees, scrubs and sealed areas. Results were stitched together and border effects were removed to create the final information product for import into ArcGIS, a geographic information system from Esri (www.esri.com).
Project Outcome
Analyzing an area of this size requires large amounts of data to be processed in a timely and cost-efficient manner. By replacing manual analysis routines with an automated software-assisted approach, it was feasible to develop land-use models for large areas with minimal resources. Manual analysis of one building might cost 2“4 euros, but the automated approach costs only 0.1“0.2 euros.
An accuracy assessment of the resulting shapefiles showed that built-up and forested areas were correctly classified for 94.3 percent and 96.1 percent of the area, respectively. With high levels of accuracy achieved at a low cost, the project was deemed to be successful, and additional iterations are planned for each of the next four years.

