Earth imagery's unparalleled insights and transparency are elevating our understanding of today's interconnected world. From Earth-orbiting satellites armed with an incredible array of sensors to cutting-edge digital airborne platforms capable of collecting striking detail, the following images highlight a few of the many ways Earth observation chronicled some of 2012's noteworthy events and interesting phenomena.
Tracking an Undesirable Import
Dust Dominates Aerosol Arrivals to North America
A dust plume arose over Inner Mongolia and began its eastward journey over the Sea of Japan on April 9, 2012. According to a NASA analysis of data from the Terra and Cloud-Aerosol LiDAR and Infrared Pathfinder Satellite Observations spacecraft, 64 million tons of dust, pollution and other particles with potential climate and human health effects survive a trans-ocean journey to arrive over North America each year. Global aerosol transport models reveal that about 60-70 percent of the dust reaching North America comes from Asia, and the remaining 30-40 percent comes from Africa and the Middle East.
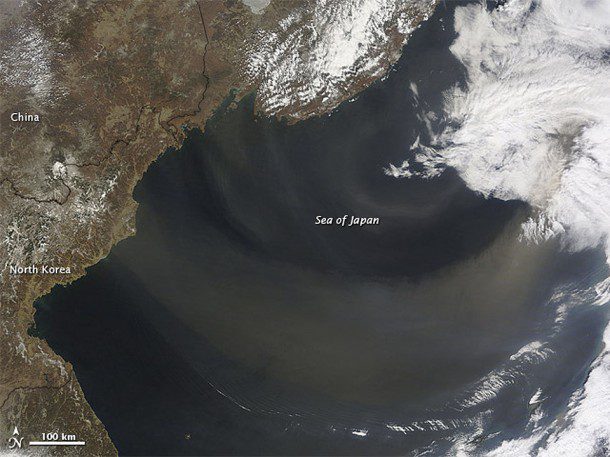
Researchers estimate that dust crossing the Pacific Ocean accounts for 88 percent of the total particle import to North America every year. Click on image to enlarge.
Creating a View from the Top
New Blue Marble Image Highlights Northern Latitudes
There have been many images of the full disc of Earth from space”a view often referred to as the Blue Marble”but few have looked quite like this. Using natural-color images from the Visible/Infrared Imaging Radiometer Suite on the recently launched Suomi-NPP satellite, ocean scientist Norman Kuring of NASA's Goddard Space Flight Center pieced together this composite image of Europe, Asia, North Africa and the entire Arctic.
The image was compiled from 15 satellite passes made by Suomi-NPP onMay 26, 2012. The spacecraft circles Earth from pole to pole at an altitude of 824 kilometers (512 miles), so it takes multiple passes to gather enough data to show an entire hemisphere without gaps in the view. Kuring stitched the image swaths together and then set up this view looking down from 70 degrees north, 60 degrees east, i.e., the view is artificial, as the satellite doesn't see the full disc at one time.
 It was possible to show the Arctic in this image because northern hemisphere spring spreads enough sunlight over the North Pole to allow a natural-light view.
Think Tornadoes Are Powerful?
Deadly Derecho Carves 600-Mile-Long Swath
On June 29, 2012, a windstorm started in northwestern Indiana and traveled roughly 600 miles (1,000 kilometers) eastward to the Atlantic Ocean. During the next 10 hours, the fast-moving storm toppled trees, downed power lines and left more than a million residents without power in the District of Columbia alone.
Meteorologists call such a storm a derecho, derived from the Spanish term for straight ahead. Derechos generally blow in one direction and don't swirl like tornadoes, but they can cause tornado-style damage. The U.S. National Oceanic and Atmospheric Administration reported that the wind gusts in the June 29 derecho rivaled those of an EF-1 tornado. The massive windstorm also was associated with a long line of thunderstorms stretching for hundreds of miles.
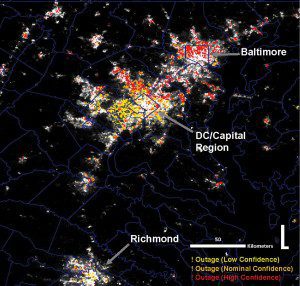
The derecho left massive power outages in its path that were detected by the Visible Infrared Imaging Radiometer Suite on the Suomi-NPP satellite.
The derecho left massive power outages in its path that were detected by the Visible Infrared Imaging Radiometer Suite on the Suomi-NPP satellite. Radiances for June 30, shown at left in shades of gray over the Washington, D.C., region, are superimposed against detections of outdoor light outages shown as yellow, orange and red outage flags that represent the level of confidence the observance is a true outage.
Weather radar images revealed the location of the derecho storms every two hours. North American Land Data Assimilation System data, available in the NASA Giovanni data analysis system, provided estimates of the rainfall intensity, which peaked at an hourly rate of more than 39 kilograms of water per square meter (nearly 72 pounds of water per square yard) as the storms neared the Ohio-West Virginia border.
- The extent of the U.S. drought's damage to crops is depicted in this vegetation anomaly map based on data from the Moderate Resolution Imaging Spectroradiometer on NASA's Terra satellite. The map contrasts plant health in the central United States between June 25 and July 10, 2012, against the average conditions between 2002 and 2012. Brown areas show where plant growth was less vigorous than normal, cream colors depict normal levels of growth and green areas indicate abnormally lush vegetation. The image is based on the Normalized Difference Vegetation Index, a measure of how much plant leaves absorb visible light and reflect infrared light. Drought-stressed vegetation reflects more visible light and less infrared light than healthy vegetation.
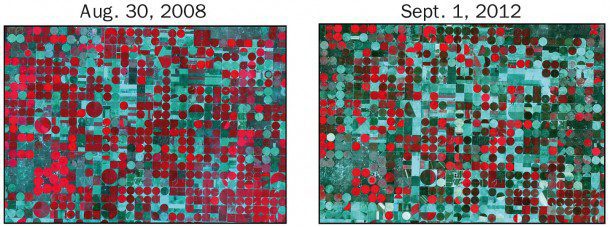
Kansas was particularly hard hit by the 2012 drought, as illustrated by this image pair acquired south of Garden City on nearly the same date in two different years by the Advanced Spaceborne Thermal Emission and Reflection Radiometer. Red indicates strong vegetative growth in the false- color image pair. Drought conditions were much less severe in 2008, whereas in 2012 they were in the most extreme category.
Farmers across the United States hoped for rain during the summer of 2012 as a drought of historic proportions parched key commodity crops, including corn, soybeans and wheat. On July 11, the U.S. Department of Agriculture announced that more than 1,000 counties in 26 states qualified as natural disaster areas”the largest total area ever declared a disaster zone by the agency. By the end of July, 63 percent of the contiguous United States was in drought, affecting crops and water supplies.
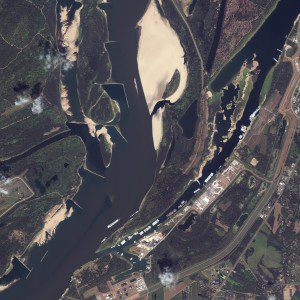
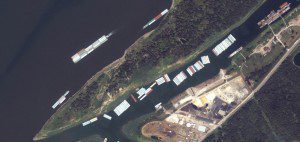
A 1-meter-resolution IKONOS satellite image was collected near Greenville, Miss., on Aug. 7, 2012, showing the low-water levels of the Mississippi River caused by the 2012 drought. On Aug. 20, the Corps of Engineers closed an 11-mile stretch of the drought-parched waterway to dredge new channels because the river reached record lows. The low water levels stranded more than 93 vessels and barges.
A 1-meter-resolution IKONOS satellite image was collected near Greenville, Miss., onAug. 7, 2012, showing the low water levels of the Mississippi River caused by the 2012 drought. On Aug. 20, the Corps of Engineers closed an 11-mile stretch of the drought-parched waterway to dredge new channels because the river reached record lows. The low water levels stranded more than 93 vessels and barges.
Feeling the Heat
Wildfires Rage Across Colorado
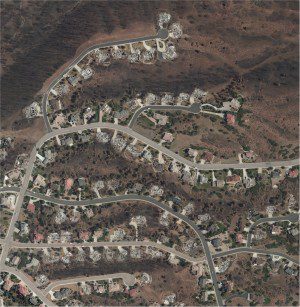
Nearly half of the U.S. airborne fire suppression equipment was operating over Colorado during the summer of 2012, as tens of thousands of acres and hundreds of homes burned. The High Park fire in the mountains west of Fort Collins, caused by a lightning strike, first was detected on the morning of June 9, 2012. The fire killed one person and burned more than 87,250 acres (136.33 square miles), becoming the second-largest fire in recorded Colorado history by area burned, after the Hayman fire of 2002. It destroyed 259 homes, surpassing the number consumed by the 2010 Fourmile Canyon fire.
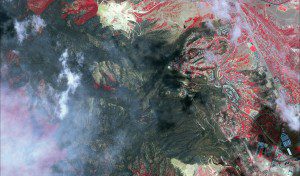
Aerial and satellite imagery shows the extent of the damage after the Waldo Canyon fire, the most destructive in Colorado's history. Numerous imagery sources were used to assess and measure damage to forest and other types of land cover. Additionally, Earth imagery is used for fire modeling, disaster preparedness, insurance and risk management, and disaster mitigation efforts to control erosion or flooding after a fire is out.
The High Park fire's record as the most destructive in Colorado history in terms of the number of homes burned didn't last long, as it was surpassed about a week later by the Waldo Canyon fire near Colorado Springs. The Waldo Canyon fire began on June 23, forcing the evacuation of more than 30,000 residents, including a partial evacuation of the U.S. Air Force Academy. Two fatalities occurred, and 346 homes were destroyed. The fire was fully contained on July 10. Its cause was reported to have been of human origin.
Astrium's SPOT 6 Satellite Delivers First Images
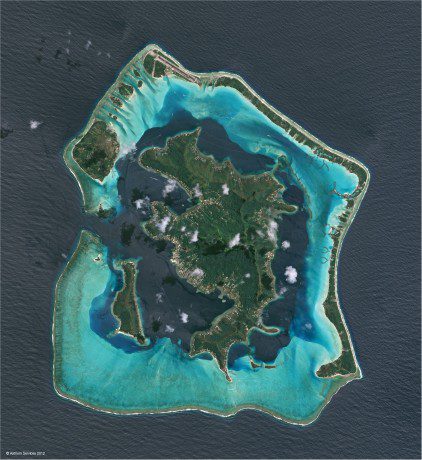
Astrium Services posted the first SPOT 6 satellite images, just three days after its launch on Sept. 9, 2012. Like its twin SPOT 7, which is slated for launch in early 2014, SPOT 6 has a 60-kilometer swath width and produces imagery products with a resolution down to 1.5 meters. The satellites will ensure service continuity from the SPOT 4 and SPOT 5 satellites, which have been operating since 1998 and 2002, respectively. The newer satellites and their ground segments are designed for improved performance compared with previous SPOT missions, especially in terms of responsiveness, collection capacity and agility, as they can be aimed quickly at any point within 1,500 kilometers of their position. SPOT 6 and SPOT 7 will be operated by Astrium Services along with two high-resolution Pléiades satellites, which will be in the same orbit. While SPOT 6 and SPOT 7 will provide wide views over large areas, Pléiades 1A (launched in December 2011) and Pléiades 1B will offer products with 50-centimeter resolution.
Astrium Services posted the firstSPOT6 satellite images, just three days after its launch onSept. 9, 2012. Like its twinSPOT7, which is slated for launch in early 2014,SPOT 6 has a 60-kilometer swath width and produces imagery products with a resolution down to 1.5 meters. The satellites will ensure service continuity from theSPOT4 andSPOT5 satellites, which have been operating since 1998 and 2002, respectively.
The newer satellites and their ground segments are designed for improved performance compared with previousSPOTmissions, especially in terms of responsiveness, collection capacity and agility, as they can be aimed quickly at any point within 1,500 kilometers of their position.
SPOT6 andSPOT7 will be operated by Astrium Services along with two high-resolution Pléiades satellites, which will be in the same orbit. WhileSPOT6 andSPOT7 will provide wide views over large areas, Pléiades 1A (launched in December 2011) and Pléiades 1B will offer products with 50-centimeter resolution.
Melting Sea Ice Sets Record
Arctic Ice Recedes to Lowest Level in 33 Years

On Sept. 16, Arctic sea ice appeared to have reached its minimum extent for the year and reinforces the long-term downward trend in Arctic ice extent. The sea ice extent will now begin its seasonal increase through winter.
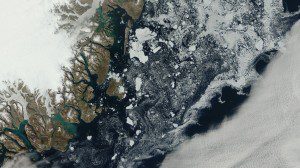
A new record for sea ice wasn't the only unusual event in the Arctic in the summer of 2012. July 2012 saw widespread melt on the Greenland ice sheet. Here sea ice swirls in ocean currents off the east coast of Greenland on Aug. 17, 2012, as seen by the MODIS instrument on NASA's Terra satellite. Greenland's ice sheet and outlet glaciers can also be seen at left.
In August and September 2012, sea ice covered less of the Arctic Ocean than at any other time since at least 1979, when the first reliable satellite measurements began. NASA and the National Snow and Ice Data Center (NSIDC) announced in mid-September that the extent of Arctic sea ice had dropped to 3.41 million square kilometers (1.32 million square miles)”well below the previous record of 4.17 million square kilometers (1.61 million square miles) set in 2007. The new record fits into a larger pattern of a changing Arctic. Regarding the rapid loss of Arctic sea ice, NSIDC Director Mark Serreze remarks, What is perhaps most surprising is that we are no longer surprised.
Packing a Wallop
Aerial Images Show Late October Superstorm's Immense Power
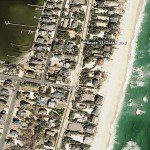 Before-and-after aerial images of the New Jersey coastal towns of Mantoloking and Seaside Heights clearly illustrate why meteorologists are calling Hurricane Sandy Superstorm Sandy.
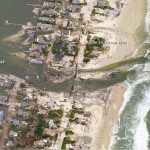
Above, an aerial image acquired Oct. 31, 2012, by NOAA's Remote Sensing Division with a Trimble digital sensor system shows damage caused by Hurricane Sandy from an altitude of roughly 7,500 feet. The storm's impact becomes strikingly apparent when compared with another NOAA image acquired March 18, 2007.
As shown at right, entire blocks of houses in Mantoloking along Route 35, also known as Ocean Blvd., were damaged or completely washed away by the storm surge and wind. Fires raged in the town from ruptured natural gas lines that ignited, and county officials declared the recently built $25 million Mantoloking Bridge unstable and closed it. Additionally, a new inlet was cut across the island, connecting the Atlantic Ocean and the Jones Tide Pond. Meanwhile, in Seaside Heights (below), the storm twisted and mangled 40 rides in the town's amusement park.
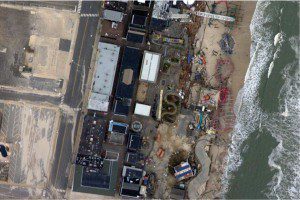
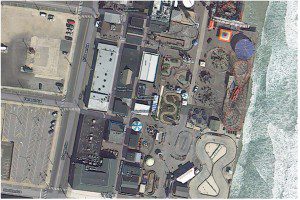
At FunTown pier in the small New Jersey coastal town of Seaside Heights, 40 of the 44 rides were damaged. The storm washed away an entire 50-foot section of the elevated wooden boardwalk.
At FunTown pier in the small New Jersey coastal town of Seaside Heights, 40 of the 44 rides were damaged. The storm washed away an entire 50-foot section of the elevated wooden boardwalk.
Observing Human Impact
MDASAR Composite Image Is a Valuable Land-Use Tool
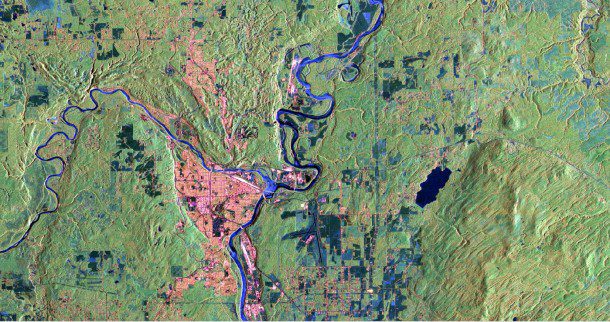
The bright blue ribbons of the Fraser and Nechako rivers frame Prince George in this RADARSAT-2 satellite composite image. Urban areas are clearly identifiable in bright pink. Areas of temporal change, such as seasonal agriculture or logging, display as various shades of blue, depending on the degree of change that occurs. Stable, forested areas show as shades of green.
Prince George sits at the confluence of the Fraser and Nechako rivers in north British Columbia, Canada. Synthetic aperture radar satellite imagery, as captured byMDA's RADARSAT-2 satellite, provided the town with an effective way to monitor land use change over large areas.
Captured using RADARSAT-2's 5-meter-resolution MF mode, the composite of 15 images over a 15-month period gives a sense of the change that takes place over time and is of great value to city planners, agricultural ministries and other agencies responsible for managing land use.
Kermadec Islands Erupt
NASA Sleuth Scientist Pinpoints Undersea Volcanic Vent
seen in 18 years at sea.”]![After large areas of floating pumice in the South Pacific were spotted from aircraft and investigated by ship crews in late July, MODIS images showed the pumice raft from space. An officer in the Royal Australian Navy was quoted as saying it was the weirdest thing [he had] seen in 18 years at sea.](https://eijournal.com/wp-content/uploads/2012/12/ii_story14-610x406.jpg)
- The 2012 Kermadec Islands eruption was a major undersea volcanic eruption produced by the previously little-known Havre Seamount near New Zealand. A large volume of low-density pumice produced by the eruption accumulated as a large area of floating pumice that was estimated to be between 7,500 and 10,000 square miles.
An extensive search of Moderate Resolution Imaging Spectroradiometer (MODIS) images by Robert Simmon of the NASA Earth Observatory discovered a steam plume and discolored water in the region on July 19. Volcanologist Erik Klemetti used underwater bathymetry to determine that the eruption site corresponded to Havre Seamount's location.
Dead in the Water
Zooming in on a Cruise Ship Disaster
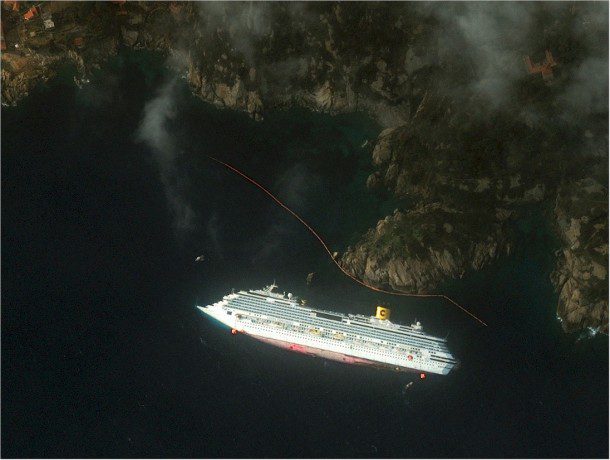
A high-resolution satellite image shows the aftermath of the Costa Concordia accident within days of the luxury cruise ship running aground in the Tuscan waters off Giglio, Italy.
The cruise ship Costa Concordia partially sank on the night ofJan. 13, 2012, after hitting a reef off the Italian coast and running aground at Isola del Giglio. Captain Francesco Schettino had deviated from the ship's computer-programmed route to treat people to the spectacle of a close sail-past or near-shore salute.
The disaster required the evacuation of the 4,252 people on board. Thirty people are known to have died, two others were still missing as of October 2012 and presumed dead, and 64 others were injured. Schettino was arrested for causing a shipwreck, failing to assist 300 passengers and failing to be the last to leave the wreck.

