By Nick Hubing, president, Land Info Worldwide Mapping (www.landinfo.com), Denver.
A little more than a decade ago, the only satellite imagery most people saw was a weather map on a TV broadcast. That changed with the launch of IKONOS in 1998, when the world's first commercial high-resolution Earth imaging satellite returned stunning images from around the globe. From more than 400 miles in space, the striking details of Egypt's Great Pyramids and San Francisco's Golden Gate Bridge suddenly came alive, inspiring a host of uses for the new data.
The golden age of high-resolution optical satellite imagery continues as users worldwide tap into this information-rich data for a host of commercial projects and research studies. All satellite imagery, however, is not created equal. A growing number of sensors and sources can make choosing the right imagery for your project seem like a daunting task. This article sheds light on some of the most important considerations when ordering and using optical satellite imagery.
It's the first number we look at and the one that grabs the headlines. Resolution, however, can refer to multiple parameters. For example, temporal resolution measures how frequently a satellite can image a target. But more commonly spatial resolution is used to describe the level of detail. An image with 1-meter spatial resolution, where each pixel represents a ground distance of 1 meter x 1 meter, has higher resolution”is more detailed”than a 5-meter resolution image, where each pixel represents a ground distance of 5 meters x 5 meters. The native ground sample distance (GSD) of images varies based on collection geometry, but images are subsequently re-sampled to a uniform resolution.
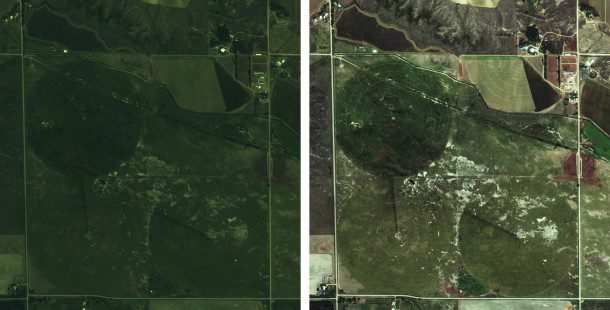
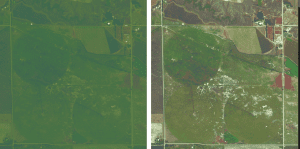
Five-meter imagery (left) can be ideal for mapping larger areas, but it won't show the same level of detail as high-resolution imagery.
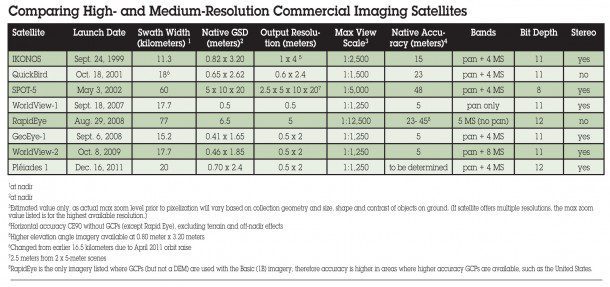
Zoomed out far enough, high- and medium-resolution imagery looks the same. The differenace becomes apparent when zooming in closer, as the high-resolution imagery”typically 1 meter or less”will display greater feature detail and show smaller features. Although digital imagery doesn't have an inherent scale, higher spatial resolution will support viewing/plotting at a larger scale (see accompanying table, page 13).
Resolution selection often is driven by size of the area of interest (AOI). Due to cost and technical considerations, high-resolution imagery usually is selected for AOIs smaller than 500 square kilometers, whereas medium-resolution imagery can offer a cost savings for AOIs 500 square kilometers and larger. Besides higher cost, disadvantages of high-resolution imagery include larger file size (there's an exponential relationship between resolution and file size) and smaller swath widths”the width across a single scene/strip of imagery.
Although there's typically some level of correlation between spatial resolution and accuracy there are notable exceptions. For example, compared with DigitalGlobe's QuickBird satellite, the company's WorldView-1 and WorldView-2 satellites offer only a moderate enhancement to spatial resolution, but because they employ new technology they achieve significantly improved native accuracy. Most satellite imagery is delivered georeferenced or georectified, but not orthorectified, which is a process that improves absolute accuracy by correcting for terrain displacement. Therefore, the accuracies listed in the table are exclusive of terrain displacement, which is significant in areas of high relief. Typically, horizontal accuracy is expressed as CE90 (Circular Error 90 percent), but it may also be expressed as RMSE (Root Mean Square Error) or as a scale. For example, to comply withU.S.national map accuracy standards for 1:12,000 scale, an orthorectified image would need to achieve 10-meter CE90 accuracy.
 In practice, collecting an image at nadir, i.e., looking straight down at the target, doesn't happen with high-resolution satellite imagery; satellite sensors always shoot at an angle. This agility improves imaging revisit times and, with some satellites, enables stereo collects for 3-D elevation modeling.
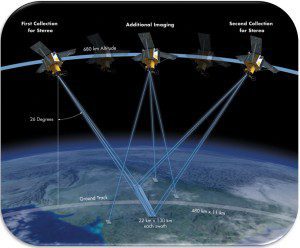
Satellite agility increases collection effectiveness and allows some sensors to perform in-line (same-pass) stereo collection.
Satellite operators may report this either as elevation angle, where 90 degrees is looking straight down, or off-nadir angle, where 0 degrees would be looking straight down. A typical minimum is an elevation angle of 60 degrees, which is a 30-degree off-nadir angle. A high-elevation angle (lower off-nadir angle) often is desirable, especially in areas of high relief or tall buildings to minimize what's known as the building-lean effect.
However, the desire for a higher elevation angle must be weighed against the resulting decreased imaging revisit time. A 70-degree or higher elevation angle (20 degree or less off-nadir angle) decreases the number of potential attempts the satellite can make in a given time period, making a successful new collect less likely.
Sun elevation is the angle of the sun above the horizon. Imagery collected with low sun elevation angles may contain data that are too dark to be usable. A typical minimum sun elevation angle is 30 degrees, but adhering to this requirement means that northern latitudes above 35 degrees will have black-out periods during the winter months when imagery with an acceptable sun elevation angle can't be collected.
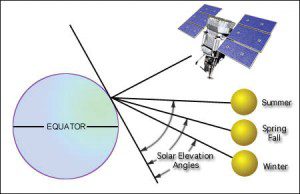
Changes in sun elevation angle cause variations in the illumination conditions under which imagery is obtained.
Decreasing the minimum required sun elevation angle to 15 degrees means that only northern latitudes above 50 degrees will have a black-out period; even a 30-degree sun angle is low for many applications. For example, increased shadow areas are problematic for classification and stereo projects. This will be more pronounced in high-relief areas and areas with taller objects, such as trees and buildings, where low sun elevation angles mean longer shadows will be cast.
For some of the affected land masses, these black-out periods correspond to months with snow cover, making new collects during these times less desirable regardless. In areas such as Alaska, where sun angle and snow cover limit the window for optimal imaging, optical satellites currently are unable to meet the high demand for imagery.
 Each imaging band measures different wavelengths of light. Most commercial optical imaging satellites capture panchromatic (pan, viewed as monochromatic gray scale) imagery at higher resolution and four multispectral (MS) bands”red, green, blue and infrared”at one-fourth the resolution to support a colorization process called pan-sharpening. Notable exceptions to this include WorldView-1 (pan only); WorldView-2 (pan + eight MS bands instead of the typical four MS bands); and RapidEye, which acquires five MS bands but no pan imagery (see table).
The most common format for typical users is true or natural color, which is three-bandRGB(red, green, blue) pan-sharpened, as most users desire the combination of color and spatial detail. However, advanced users performing classification or analysis generally prefer four-band imagery, because the infrared band is helpful for vegetation analysis (see Project Example: Classification Maps, page 11).
Smaller file size used to be considered an advantage of pan imagery, but with increased computing capability, that has become less of a constraint. Pan imagery remains the preferred format for digital elevation model (DEM) generation from stereo pairs. When importing multiband imagery, different combinations can be selected. Four-band imagery 3-2-1 typically corresponds to true/natural color, whereas 4-3-2 represents false color/infrared.
Bit Depth
Beginning with GeoEye's IKONOS satellite, all leading high-resolution commercial imaging satellites capture 11-bit imagery, meaning a maximum of 2,048 digital numbers (DNs) per band instead of the earlier 8-bit/256 levels. RapidEye's satellite constellation and Astrium's Pléiades satellite offer the additional advantage of collecting 12-bit imagery. Improved bit depth aids the ability to discern detail in an image's brightest and darkest (shadow) areas.
 Most computers require data in 8-bit format, so an 11- or 12-bit image can have the color table (DNs) downsampled to 8-bit or upsampled to 16-bit. In this case, the four or five unused bit locations are filled with zeros, creating a 16-bit file format but not a true 16-bit image.
Imagery used for classification or analysis, or that which must be tonally balanced, always should be ordered in 16-bit format. For many users, however, there's convenience to using 8-bit imagery”smaller file sizes and no software compatibility issues.
Dynamic Range Adjustment
When delivering 8-bit imagery, high-resolution satellite operators typically will perform an automated process to adjust contrast and brightness. Dynamic range adjustment (DRA) offers a time savings for load-and-go imagery, so a user can avoid running a manual adjustment. This is prone to fail in certain areas, however, such as a desert where the color spectrum isn't balanced. In such instances, a manual adjustment will yield better results. Manual contrast adjustment also tends to work better with pan imagery.
 Although many programs now perform on-the-fly reprojections, ordering imagery in the same projection as other project data being used is still desirable. Stereo imagery for DEM generation often will be ordered as epipolar; however, a Universal Transverse Mercator (UTM) ortho later can be output. Because satellite operators offer a limited selection of projections, supporting a region-specific datum may require a custom reprojection.

Cubic convolution typically is the default resampling method for Earth imagery, but the enhanced kernel”a hybrid of
cubic convolution”is recommended for DigitalGlobe's pan-sharpened products. For research applications, where image data may be converted to radiance values, nearest-neighbor resampling offers the advantage of not introducing any new values to the imagery, but it can introduce what appear to be geometric and color defects. Most imagery users wouldn't be satisfied with the appearance of imagery processed with the nearest-neighbor method.
 Because high-resolution imaging satellites are able to shoot off-nadir, their revisit times”ability to repeat coverage of the same AOI”is three days or less. Employing multiple high-resolution satellites on the same AOI means that intraday
revisits are theoretically possible. However, in the real world, clouds and competition for satellite time are significant obstacles.
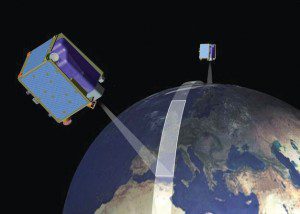
RapidEye's constellation approach permits a cumulative swath to be built up as multiple satellites view adjacent regions of the ground.
A satellite's collection capacity is determined by its swath width (see table), agility to point and shoot at multiple targets or capture multiple adjacent strips for large-area mapping on the same orbital pass, onboard storage and downlink capacities. Pléiades 1, GeoEye-1, WordView-1 and WorldView-2, and other satellites offer significantly improved collection capacities than their predecessors, while the older satellites, such as IKONOS and QuickBird, may have better available capacity to collect an AOI in regions where the newer satellites have demand backlogs.
A satellite such as Pléiades 1, which doesn't have a U.S. government backlog, also may be able to offer faster commercial tasking. Tasking two or more satellites for the same AOI improves the ability for imagery to be captured. For example, DigitalGlobe offers constellation order fulfillment (COF) where QuickBird and WorldView-2 can be tasked to acquire the same AOI with no cost uplift. RapidEye further leverages the constellation concept by employing a system of five identical satellites to facilitate country- and regional-scale mapping and saturating coverage of areas with persistent cloud cover.
When placing a new collect order, a feasibility assessment typically will be run to estimate the turn-around time. The feasibility takes into account potential cloud cover for the region and competition for satellite time in the area. Because collection queues can change daily and cloud cover is uncontrollable, feasibilities are only estimates, not guaranteed collection times. Most satellite operators offer priority tasking for an additional charge. Areas that have both high demand for imagery and persistent cloud cover are challenging to collect regardless of time of year and are likely to require lengthy turn-around times.
It's important to note that due to sun-synchronous orbits, there's little control over the time of day an AOI is imaged. Collects, which are made only on the descending orbit, typically are made around 10:30 a.m. local time over a desired AOI. Because high-resolution imaging satellites orbit Earth 15 times a day, an interesting exception to this is polar latitudes. Because Earth narrows at extreme latitudes, intra-day collects via the same satellite are possible, presuming an acceptable sun angle.
 Typical cloud-cover guarantee with new collections is 15 percent or less within the project AOI. Some satellite operators offer an improved cloud-cover guarantee for a cost uplift or the ability to choose a small cloud-free target area that must have zero cloud cover. This option is well suited for infrastructure sites such as airports, mines, and oil and gas installations.
Typically, if the satellite operator can't deliver a new collect that meets order specifications during the estimated collection window, the customer can either extend the collection window or cancel the order at no charge. With archived imagery, a reduced-resolution preview graphic can be reviewed ahead of time, although it can be difficult to detect small clouds or haze.
 Traditional delivery methods have been FTP, DVDand external hard drive. As FTP capabilities have improved and the cost of external hard drives has come down, DVDis being used less frequently. Before ordering a large area with DVDdelivery, it's worthwhile to consider the time required to upload from
DVD to hard drive vs. the extra cost of delivery on external
hard drive. Heavy imagery users also will benefit from an upgrade toUSB 3.0.
Leveraging Professional Guidance
Although this article discusses parameters dealing with ideal imagery collection scenarios, real-world cost and turn-around time constraints often mean imagery users will need to consider available imagery. For example, in a high cloud cover/high tasking competition area such as Indonesia, the best option may be to use a less than optimal archived image because a new collect likely would require a lengthy turn-around time and not come back entirely cloud-free.
In such instances, an experienced geodata professional can help users understand the acceptable trade-offs for a proposed project. Working with an independent data company, often called value-added resellers (VARs) or channel partners, can help ensure the optimal imagery solution for your specific project/area instead of limiting the range of options to one satellite operator. VARs typically offer imagery at the same price as the source company.
A specialized data company can source DEMs and ground control as needed and can offer custom processing and flexible delivery options. For example, imagery can be ortho output as 16-bit pan plus MS for users with more advanced remote sensing software and three-band, 8-bit pan-sharpened mosaics with contrast adjustment, in GeoTiff and wavelet compressed formats, for users with daily computer-aided drafting (CAD), geographic information system (GIS) and graphics software applications.
In areas where the selection of archived imagery is limited, a value-added vendor can combine imagery from multiple sensors into the same mosaic. In addition, products can be processed to complement each other. For example, high-resolution imagery with superior native accuracy can be used as control to improve the accuracy of medium-resolution images covering larger areas.
Additional Options Abound
Along with the leading commercial optical satellite imagery products, many additional optical imagery solutions exist. Where available, aerial photography can be an alternative to high-resolution satellite imagery. Agriculture projects that may require large area collection in a short time window will benefit from the large swath width of satellites such as DEIMOS-1 or AWiFS. CBERS data should be considered for any project in South America where medium-resolution imagery is required.
The Japanese satellite ALOS no longer is collecting new imagery, but archived imagery collected during its five-year lifespan is available at moderate cost. The range of imaging satellites is too numerous to list, but includes options such as KOMPSAT, EROS, FORMOSAT, the IRS constellation, Resourcesat and Cartosat, among other sensors. Public-domain Landsat and low-cost ASTER imagery can facilitate projects where commercial imagery may be cost-prohibitive; both Landsat and Astrium's SPOT Image products offer extensive historical imagery archives.


