By Woolpert's Qassim Abdullah, Ph.D., PLS, CP and Nadja Turek, PE, F. SAME, LEED AP BD+C, GGP, Envision SP
May 2021
![]()
Abstract
This paper discusses the aerial acquisition of thermal imagery and introduces thermography, acquisition parameters, atmospheric variables and factors impacting thermal sensor operations on fast-flying aircraft. It also examines the following elements that are crucial to selecting suitable sensors and cost-effective acquisition methods:
- Project area
- Ground resolution of thermal imagery
- Positional accuracy of resulting products
- Size and number of structures within the project coverage
- Roof and buildings materials
- Availability of nadir and/or oblique imagery
This paper concludes with an evaluation of the qualitative and quantitative data analysis, including information-based energy auditing and heat score mapping, made possible by thermal imagery.
Background
Thermography Defined
Temperature, or heat energy, is a key variable in virtually all processes around us. In the human body, a deviation of even a few degrees from the normal body temperature of 98.6°F is an indication of infection. In the kitchen, baking a cake at the wrong temperature will prevent it from rising properly and result in poor taste and texture. Countless similar examples exist in facility and industrial applications.
Thermography, or the science and technique of conducting heat inspections using imaging sensors or cameras, visually captures minute changes in temperature and has many advantages over traditional contact-spot heat inspections. Among these advantages are:
- It is non-contact in nature and keeps operators out of danger.
- It is two-dimensional, which provides a fuller understanding for interpretation than a one-dimensional spot.
- It can be conducted in real time and upon fast-moving targets.
- It does not intrude upon examined objects.
- It is non-destructive; for example, buried utilities can be inspected without excavation.
Value of Thermal Imagery
Imagine a scenario in which a water main, located next to a steam line, breaks and undermines the surrounding soil. The responding employee is badly burned by the heated water because the as-built map incorrectly located the steam line. An accurate thermal (i.e. heat) map of the area would have prevented harm to the employee.
Thermal imaging is a technology that captures differences in temperature and can be used to locate anything the emits heat”including utilities. Clients regularly report using thermal imagery to identify missing or incorrectly located utilities. Updated records with accurate thermal imagery locations enhance safety for employees and customers.
Recognized as an effective, non-destructive method for inspecting buried utilities, thermal imaging helps facility engineers identify potential problem areas early and prioritize planned maintenance efforts. Through this technique, it is possible to inspect utilities, such as steam and hot water, for heat loss without damaging the surrounding pavements. However, much of today's current thermal imagery is low-resolution, geospatially inaccurate and imprecise, leaving imagery interpretation and corrective action planning to the client. Woolpert is pioneering high-resolution, geospatially accurate thermal imagery with both automated and engineering analysis to bring value to facility and utility managers.
Energy audits provide a systematic approach to discovering energy issues and making sound decisions. The primary goals of an energy audit are to qualify and quantify the performance of building energy systems, identify opportunities for improvement and assess the potential outcomes of those improvements, both in financial and non-financial terms.
Time intensive and expensive, yet ripe for innovation, building energy audits require qualified auditors to acquire on-site data, one building at a time. However, sizable campuses such as military bases, utility service areas, business parks or university campuses are often so large and diverse, with multiple building construction types and uses, that the traditional approach to energy auditing can be not only time but also cost prohibitive. For example, an ASHRAE Level 2 audit that runs, on average, $0.10 to $0.15 per square foot, could cost a single campus hundreds of thousands of dollars and take several years to complete, before capital improvement projects even begin.
Facility managers need actionable energy audits in months, not years, to save money, energy and emissions. Innovative auditing methods and cutting-edge technology are necessary for transforming the auditing industry for large facilities, campuses and land holders.
Woolpert invested research and development resources into exploring the use of digital thermal imagery for inspecting underground utilities and analyzing the energy loss of residential and industrial facilities. A team of researchers from Woolpert and the University of Dayton developed and tested a new remote sensing-based method for conducting information-based energy audits. The long-term objective was to use thermal imagery to facilitate comprehensive energy audits and energy loss analysis with limited on-the-ground resources and reduced timeframes.
Remote auditing techniques enable the accurate identification of numerous energy efficiency measures (EEMs) without the necessity of building visits. This approach integrates readily accessible data”GIS building and property data, historical utility energy use data, historical weather data and aerial building thermal imagery (thermography)”with advanced remote sensing technology to analyze the energy performance of a building without stepping foot on site.
Woolpert also developed and introduced an enhanced version of a regional heat score map (HSM) as an intuitive way to visualize energy efficiency problems and motivate owners or utilities to implement EEMs. Originally developed by the University of Calgary, Canada, the HSM is a GIS-based map that uses thermal imagery and modeling algorithms to evaluate energy loss from building rooftops. This visual tool compares heat loss across buildings in a specified region, enabling owners/managers to easily identify the roof area(s) needing inspection and/or repair. When offered by utility companies, the tool helps customers to view their heat scores and easily contact the utilities or recommended contractors to initiate needed improvements. The tool also has the potential to be used by private or government owners of large building inventories to manage energy consumption.
Methods of Collection
The preferred mode of thermal collection is largely dependent on the size of the collection area and the goal of the project. Manned aircraft, unmanned aircraft systems (UAS) and handheld scanners are all methods that, correctly tailored and applied, can be used for efficient and cost-effective thermal imagery collection.
Manned Aircraft
For large projects requiring an overall campus collection, manned aircraft mounted with thermal cameras and natural-color digital cameras are often the best collection tools. Manned aircraft can remain in the air for significantly longer than most UAS, and they can cover large footprints with speed and efficiency. In addition, manned aircraft can acquire both nadir and oblique imagery to cover the roof and four building facades.
UAS
UAS is often impractical for large-collection flight plans. Limited by battery life and extreme temperature conditions, UAS typically have much shorter flight times than manned aircraft. Additionally, UAS flight speed is significantly less than that of the manned aircraft used to collect aerial imagery. However, for smaller flight footprints involving no more than a handful of buildings, UAS can offer an efficient, cost-effective solution.
Mobilizing UAS is significantly easier and less expensive than mobilizing manned aircraft for small-scale projects. Preferred over handheld scanners when entire building envelopes require assessment, UAS can collect imagery of roofs, difficult-to-access building faces and exterior building walls.
Current Federal Aviation Administration regulations concerning UAS do present a major challenge to using UAS for thermal imagery acquisition. Even with the latest and less-rigid regulations represented by PART 107, UAS are not permitted to fly over people not involved with the operation, nor can they be flown at night without difficult-to-obtain waivers from the FAA. These restrictions make it difficult to employ UAS for projects located within inhabited areas and most likely needs to be flown at night.
Handheld Scanners
Handheld thermal scanners or cameras are typically the most cost-effective tool for most indoor applications, and they also may be the preferred tool for outdoor applications when only a few buildings require scanning and roof imagery is not required. Using a handheld scanner requires no more mobilization than traveling to the job site with the scanner.
Image Collection and Processing
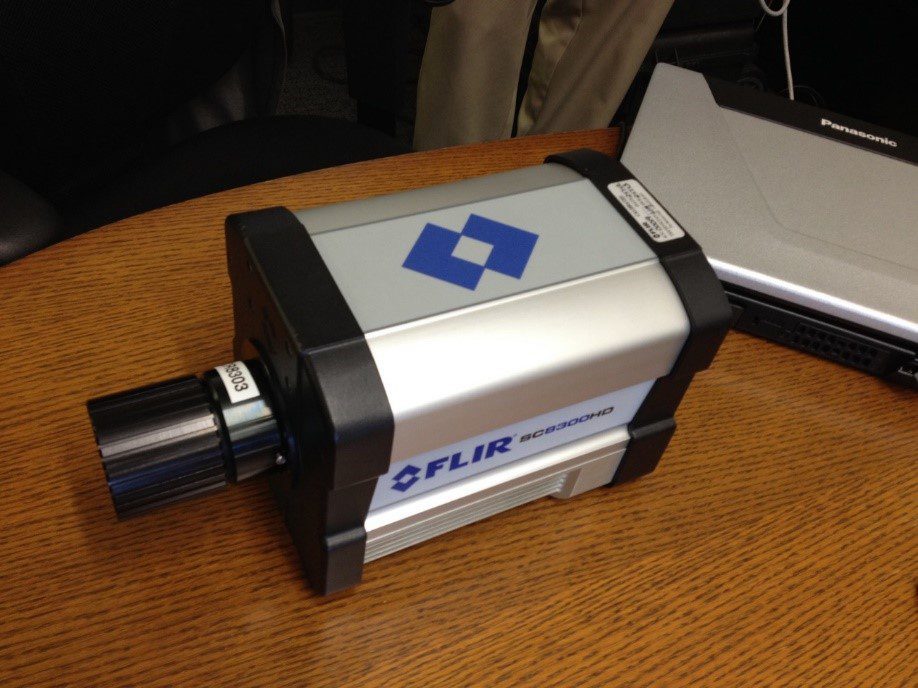
Figure 1: FLIR SC8300 HD thermal sensor (image courtesy of FLIR)
Thermal cameras with radiometric sensors are calibrated to measure the absolute temperature of every pixel in the image. Woolpert uses a state-of-the-art thermal sensing technology, the FLIR SC8300 HD science-grade cooled sensor (Figure 1). Designed with cutting-edge functionality for scientists and researchers, the SC8300 HD is a high-speed, mid-wave infrared (MWIR) camera with highly sensitive cooled InSb detectors and superb resolution. Woolpert interfaces the SC8300 with an airborne GPS system to capture the exact position in space of each thermal image during the mission. The entire system is mounted on a Woolpert aircraft modified for aerial imagery acquisition missions. The thermal imagery is usually acquired after midnight from an altitude of approximately 3,000 feet above ground level to produce thermal imagery with a ground sampling distance of 1 foot.
The acquired imagery provides thermal values for each pixel in a raster. Once corrected for emissivity and bias, these values represent individual temperatures for every pixel. The imagery is then produced in 32-bit format and processed following a stringent photogrammetric workflow to create a seamless mosaic with pixel-specific temperatures.
Complicating Factors
Our research has highlighted multiple variables impacting the quality and accuracy of the data collection.
While the camera captures return energy emitted by a surface, factors including material type and age, reflected temperature, weather conditions, and clouds between the aircraft and surface can limit the ability to obtain precise temperature values.
These variables dictate the need for robust ground-truthing to correct for atmospheric conditions and other energy-scattering phenomena. Woolpert uses handheld thermal cameras, the FLIR TGI165 and FLIR C5 (Figure 2), to measure and document the temperature of different ground surfaces during aerial thermal imagery acquisition. To ensure positional accuracy of the thermal mosaic, a set of ground control points is surveyed and used for aerial triangulation of the imagery.
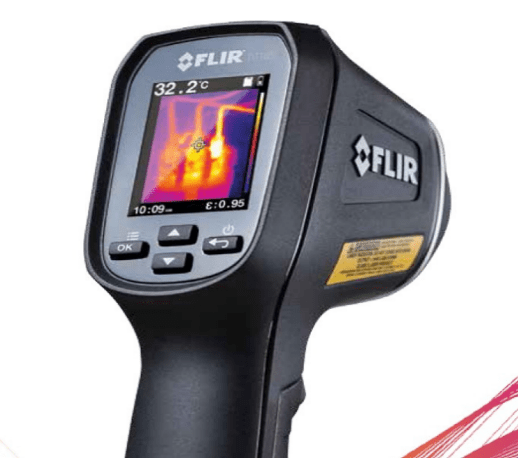
Figure 2: FLIR TGI165 and FLIR C5 handheld cameras (images courtesy of FLIR)
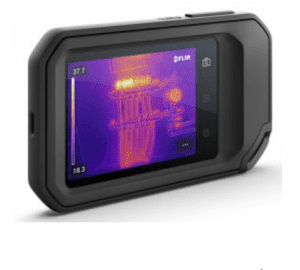
Images courtesy of FLIR
Imagery Collection Considerations Logistics
Once the appropriate mode of collection has been determined, the conditions of the collection must be analyzed. The flight plan for an aerial acquisition mission is mainly dictated by desired quality, required accuracy and sensor geometry. Once a suitable GSD is chosen for the project, then the flying altitude, sensor lens focal length and sensor array size, i.e. how many charge coupled devices (CCD) make up the sensor, can be determined.
We recommend higher ground resolution thermal imagery (i.e. 15-centimeter or 30-centimeter GSD) be flown from lower altitudes to provide the most accurate thermal modeling. Flying low places the thermal camera closer to the structures under investigation and shortens the atmospheric column that the emitted thermal energy must pass through to register with the sensor.
In addition to the thermal imagery, airborne GPS data should also be collected to support the processing and aerial triangulation required to create high-resolution, geospatially accurate images. If there is no existing colored aerial imagery of the area, natural-color imagery may also need to be flown during the day to support object verification and analysis.
The next step in collection planning is to decide if nadir (directly overhead) or oblique (at an angle) imagery is needed. The study target and objective clearly impact this decision. If assessing only roofs or utilities, then nadir collections may suffice. Nadir imagery can be collected with simple, straight flight paths back and forth over a collection area. However, if thermal imagery of exterior walls or complex building geometries is desired, then oblique collections will be necessary. In oblique collections, the sensor is aimed at off-nadir angles, usually 45 degrees, to provide side views of buildings and objects (see Figure 3). Oblique imagery collections are more time consuming and expensive than nadir collections because the flight path must cross the building multiple times in multiple directions to image every side of the building.
Figure 3: An oblique thermal view for a building from aerial survey
Finally, the following logistics considerations contribute to the complexity of image collection planning:
- Controlled airspace
- Security clearances requirements (both flight and ground personnel)
- Ground control network needs
- Ground truthing or field measurement recording needs
Nature
Atmospheric conditions also impact the quality of a collection effort. Because large temperature differentials appear more vivid in thermal imagery, winter is the preferred season for collecting thermal imagery. On hot summer days, there may be only a 15- or 20-degree difference between indoor and outdoor temperatures; however, depending upon location, cold winter nights can easily provide more than 60 degrees in temperature difference.
Thermal imagery is typically collected at night to reduce, as much as possible, the impact of thermal clutter, solar flux and reflection. It is best to wait several hours after sunset to reduce confusion between objects heated by daytime solar energy and problem hot spots caused by energy leakage. Fog, rain, snow or wind can skew thermal image appearances, so clear, dry nights are recommended for providing the best contrast, and ultimately, identifying envelope issues.
Sensor Resolution
The thermal camera itself has design characteristics that affect the ground resolution of the resulting thermal imagery. The detector geometrical resolution, i.e., the size of individual pixels and how many pixels are in the detectors (array), determines the granularity of the collected data. While high resolutions improve detail visibility, they are not always necessary and should be employed on a case-by-case basis.
Sensor Sensitivity
Thermal sensitivity indicates the smallest temperature difference between two objects that the camera can detect. Less-sensitive thermal cameras will provide values rounded to 0.2 degrees Celsius, while more-sensitive cameras may provide values to the 0.1 or even 0.01 degrees Celsius. While these differences may appear minimal, they significantly impact the crispness and granularity of the thermal imagery. Because thermal sensitivity directly affects the quality of the data collected, it naturally affects the analysis of that data.
Camera Settings
The three most important camera settings that must be verified prior to data collection are lens focus, temperature range and proper optical distance. Thermal camera operators must understand the importance of adjusting the focusing ring of the camera to get obtain clear, focused imagery. Good, consistent focus is critical to proper temperature measurements.
Temperature range is the minimum and maximum temperatures that the camera can measure and record. Once this range has been set for an imagery acquisition session, it cannot be changed at any point during data processing. Setting the correct temperature range on the sensor prior to data acquisition will result in optimal data quality because the thermal sensing ability will be optimized for the situation at hand. Expanding the range beyond that of the temperature of ground objects within the project boundary will reduce the sensor's ability to discriminate between objects with subtle temperature differences.
The last of the three settings that the operator needs to make sure is set properly before acquiring data, is the appropriate working distance to the target. Acquiring thermal imagery from the proper distance to the target results in proper resolution of the imagery and therefore target details.
During data post processing, most settings can be adjusted to enhance the imagery quality; however, the three previously mentioned cannot. One extremely important setting that can be altered during processing is object emissivity. Emissivity measures how well materials absorb and emit thermal radiation. Every material has a unique emissivity value, defined as a ratio of how well it emits thermal radiation compared to an ideal black surface at the same temperature (which is assigned a value of 1.0). Emissivity directly impacts the temperature the thermal camera detects. Inflated emissivities will inflate the recorded temperatures, and vice versa. Unlike temperature range, emissivity can be adjusted during data export and processing. Because emissivity has such a significant impact on imagery accuracy, it will be discussed again in Importance of Emissivity.
Quantitative and Qualitative Results
Thermal imagery provides opportunities for both quantitative and qualitative analysis. It can be displayed either in color or grayscale, with each color or gradient representing a range of heat emission or temperatures. The temperature range associated with different colors is a user preference that varies from project to project, though blue is commonly used to represent cool temperatures and red is often used for hot temperatures.
Collecting accurate quantitative data is often challenging with thermal cameras because of the multiple variables already discussed, including emissivity, reflected temperature, atmospheric conditions and atmospheric interference. Because of the uncertainty created by these variables, qualitative data is more frequently used for analysis.
Qualitative data enables comparative analysis between the heat signatures of similar objects for the purpose of identifying anomalies indicative of performance issues. Qualitative analysis is commonly used for inspection of roofs as well as buried and above-ground utility networks following the image interpretation concept that we use in remote sensing and mapping applications (Figure 4). While it is easier to perform, qualitative analysis alone doesn't provide enough data for an energy audit, which requires metrics for temperature and heat transfer. A quantitative analytic approach is essential for energy auditing because it provides a method for quantifying energy- and cost-reduction measures. It is important to understand the limitations of quantitative analysis and the controlled environment it requires budget for and mitigate (where possible) uncertainty and error.
Importance of Emissivity
Emissivity presents a variety of challenges to thermal imagery analysis. The limitations of determining emissivity values are a continuous hinderance, though emissivity tables can be useful for identifying approximate values for common materials. Additionally, because dissimilar materials have different emissivity values, five different materials in a single thermal image will present five different emissivity values. To obtain accurate temperature values, emissivity values must be associated correctly with their corresponding materials during image export, increasing the likelihood for multiple exports.
Another analysis challenge is that many materials do not have known emissivity values. In other cases, environmental conditions or material finishes may dramatically alter known emissivity values. A strategy for determining unknown values is to place materials of known emissivity and temperature within the same image frame to create reference points. This strategy is labor intensive but effective for identifying unknown emissivity values. To date, there are no handheld tools capable of providing accurate, real-time emissivity measurements.
Data Analysis
Once the imagery has been acquired with the appropriate platform, thermal camera and applicable camera settings, the imagery must be exported with the appropriate emissivity. This exported imagery is then processed using Woolpert's photogrammetric workflow to create seamless, georeferenced mosaics. By interpreting the qualitative mosaic or performing quantitative modeling, one can identify issues such as building envelope or moisture leaks, mechanical or electrical equipment problems or thermal bridging concerns.
Often, envelope issues such as missing insulation, leaks or thermal bridging are invisible to the naked eye. Thermal imaging reveals these envelope deficiencies as warmer relative to the surrounding envelope. When imagery is flown over a heated building on a cold evening, missing insulation and leaky window seams will present as warm areas on the thermal image. Thermal bridging also will appear warm on the thermal image. Thermal bridging occurs when more conductive materials (such as steel beams) provide less-resistant paths for heat transfer across thermal barriers (such as insulation).
Moisture issues are also picked up by the thermal camera for two reasons. The first reason is that evaporation cools material surfaces such that wet areas appear cooler than the surrounding envelope. Alternatively, if moisture is trapped in the roof, the roof may appear as a warmer area because the heat rising from the building will increase the temperature of the water vapor more quickly than the surrounding area. Because moisture can reduce the effectiveness of some kinds of insulation, such as batt insulation, areas of insulation damaged by moisture may allow even more heat transfer. The temperature difference of an area relative to the surrounding envelope, walls, roof or windows can indicate envelope issues that never would have been revealed otherwise.
Another useful application of thermal imagery analysis involves examining mechanical and electrical equipment. Malfunctioning equipment often appears warmer than nearby equipment. Hot spots on equipment may indicate that an inordinate amount of energy is emitted as waste heat instead of as the electric energy need to perform the intended task. Motors, belt drives, boilers, pumps and compressors are mechanical components that can be inspected for performance using thermal imaging. Electrical equipment such as breakers, wires and circuits can be inspected similarly. Electrical components operating warmer than surrounding elements may be malfunctioning and should be further inspected. Thermal imaging can offer an alternative look when manual inspection does not reveal any malfunction.
Ductwork and piping can be inspected for issues using thermal imaging. Depending whether the system is in heating or cooling mode, ductwork and piping leaks appear warmer or cooler than the surrounding areas. Deteriorated pipe insulation can be identified in a manner similar to that used for moisture-degraded envelope insulation. Condensate pipe leaks also may be detected with warm or cool spots (depending on condensate type). Piping for outside utilities, such as steam, hot water or chilled water, can be inspected with thermal imaging. Both above- and below-ground piping will appear in the imagery, with large hot or cool spots indicating leaks or damaged insulation. Figure 4 illustrates the clear thermal signature, shown in bright linear feature, for the buried hot water and/or steam pipes at the University of Dayton campus. Thermal imaging provides facility engineers with an accurate, non-destructive method for inspecting underground networks.
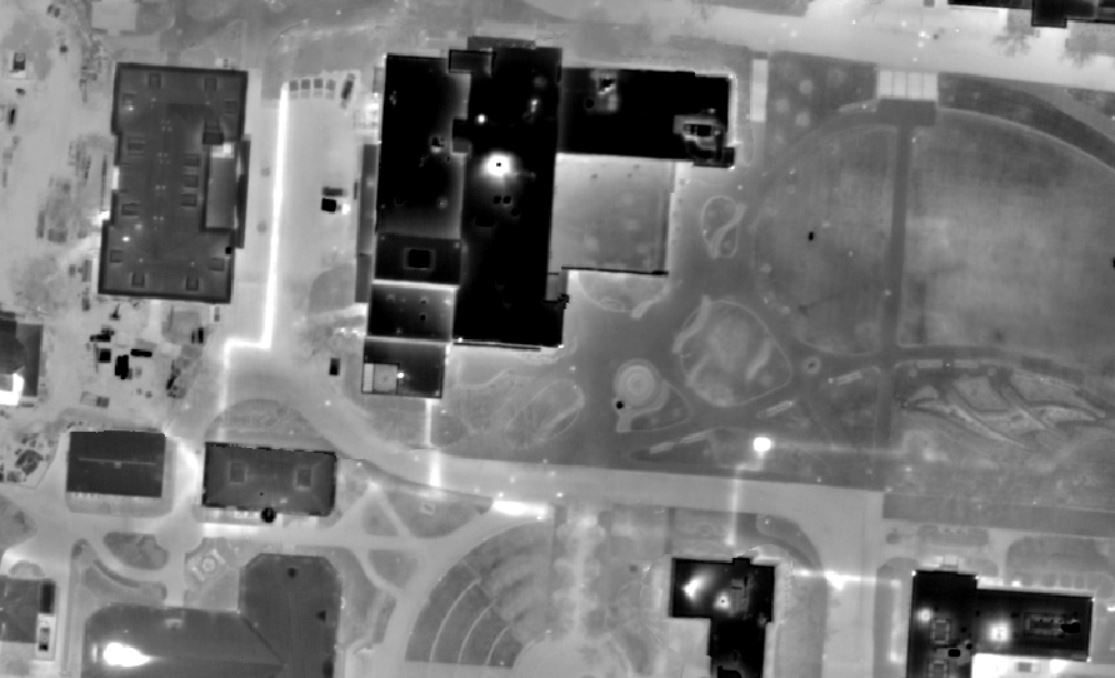
Figure 4: Buried pipes at the University of Dayton campus appear as bright (hot) linear feature under roads and parking lots
The diversity of thermal imagery applications makes it useful for a wide range of services. Thermal imagery can aid in prioritizing renovations, such as envelope repair, roof replacement, and mechanical or electrical equipment rehabilitation. Aerial thermal imagery is especially useful for roof inspections and comparisons. Campus facilities often conduct building inspections to determine the order of building renovations, and thermal imagery can assist greatly with those building inspections. Thermal imagery also informs energy audits. Building envelopes have been difficult to include in energy audits due to variables such as the quality of insulation, thermal bridging and moisture impacts. Thermal imagery enables energy audits to provide a more accurate picture of needed envelope upgrades. Finally, thermal imagery can be used to analyze utilities located outside of the building or beneath the ground and identify areas requiring repair or replacement.
Heat Score Methodology
To better understanding the power of thermal imagery for comparative analysis, Woolpert used thermal imagery to develop a heat score map (HSM) for a residential neighborhood on the University of Dayton campus. The HSM is a GIS-based map that visually depicts the thermal efficiencies of building rooftops and compares them to neighborhood houses of similar construction.
After Woolpert collected the thermal imagery, the project team created a raster mosaic with temperature values stored in every pixel (Abdullah, et al.[1] (2015)). The set was corrected for variables, such as emissivity, that could introduce error to the values. Because rooftop temperatures can be skewed by chimneys (emitting heat) or tree branches (obscuring the imagery), the team identified these objects and removed their thermal pixels from the heat score calculation.
Heat scores are developed relative to the energy efficiency or heat loss of the surrounding buildings. Heat scores range from 0, the lowest possible waste heat compared to surrounding buildings, to 100, the highest possible heat loss compared to surrounding buildings. Using the heat score methodology developed by Hemachandran[2] (2013), the heat score (based on the wasted heat modeled through the rooftop) is derived and attributed to the building polygon in the database. According to Hemachandran, a building's estimated heat waste is calculated by multiplying the building's living area by the difference between the building's average rooftop temperature and the minimum temperature recorded in the study area. Areas of significant heat loss (i.e. hot spots) will appear on the HSM and indicate insufficient insulation or water damage. The Woolpert-developed HSM uses a modern, web-based portal to provide users with thermal images of their area and color-coded heat scores with pop-up boxes explaining how their houses rank compared to other houses in the area (in terms of heat loss). See Figures 5, 6 and 7.
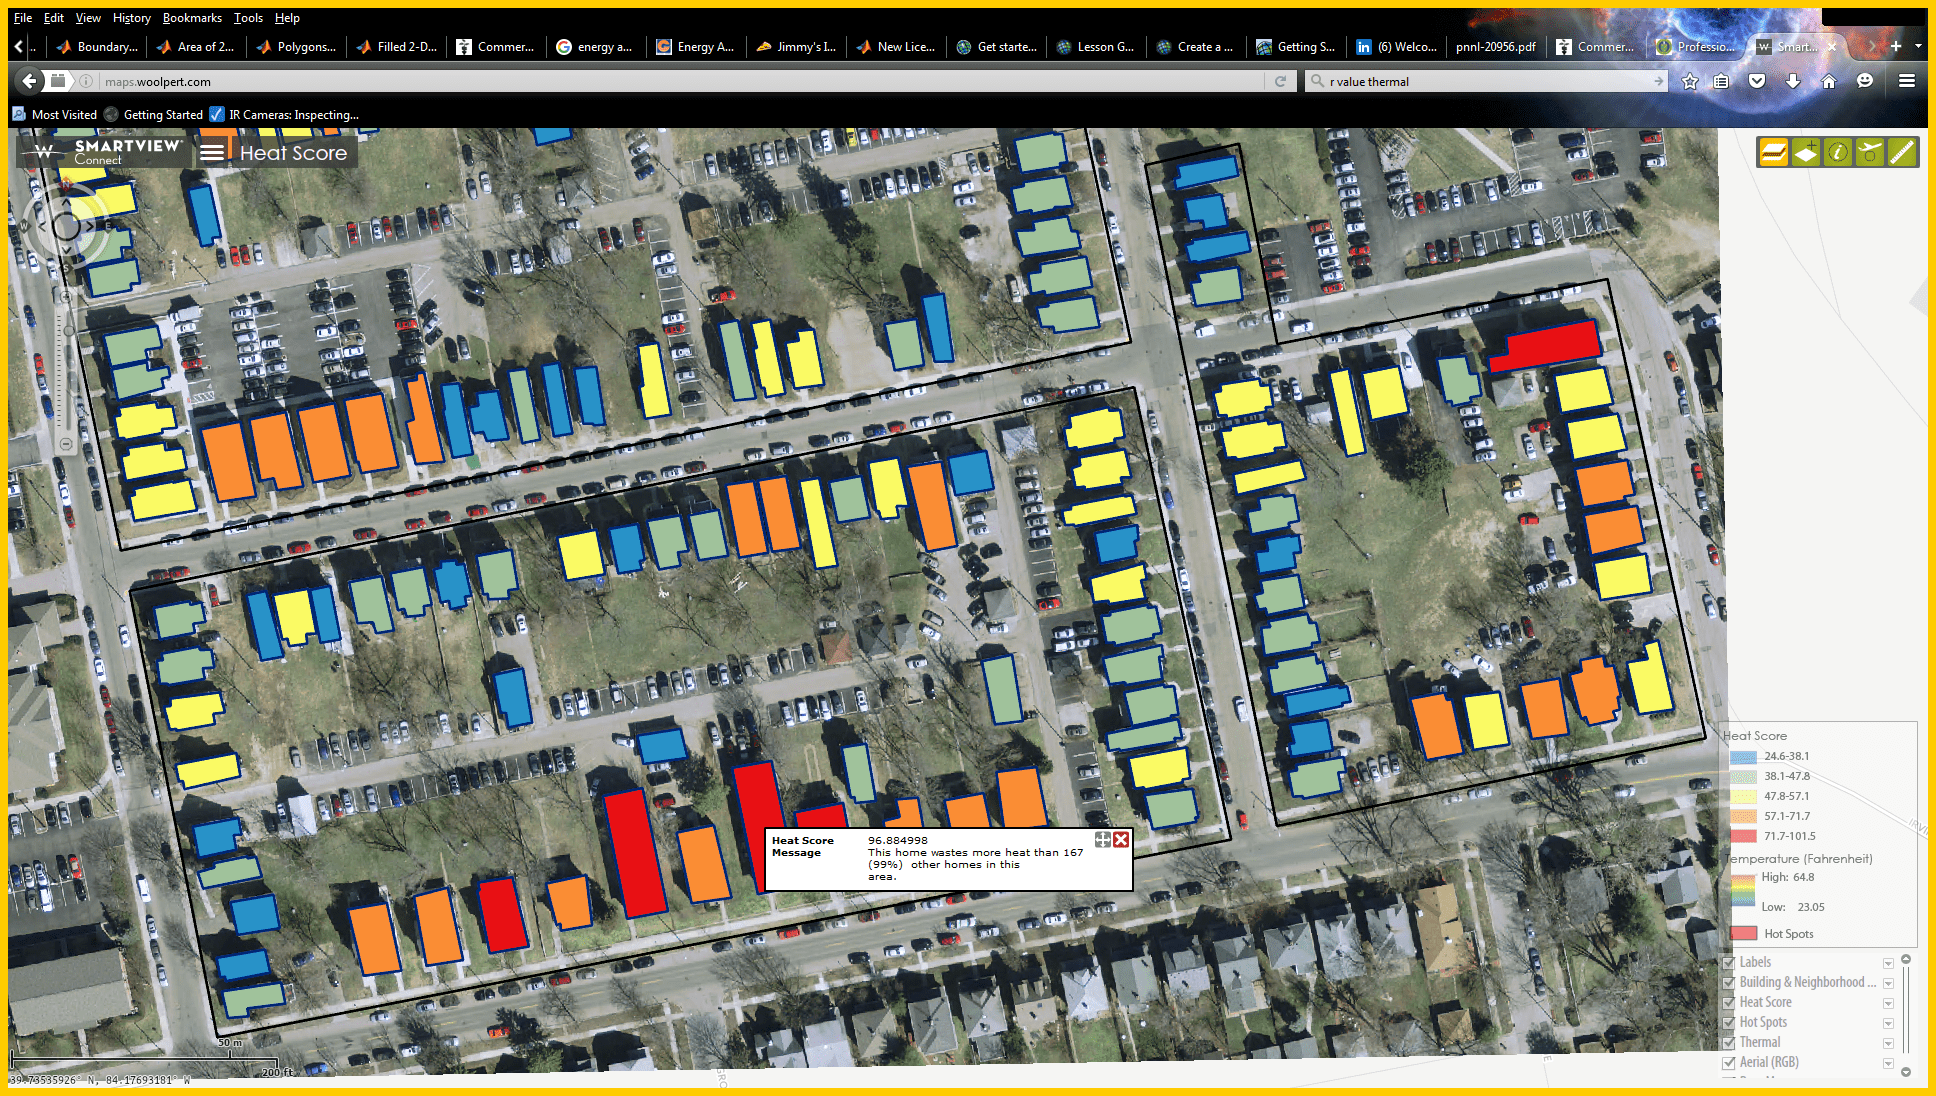
Figure 5: Woolpert's HSM portal

Figure 6: Woolpert’s HSM portal showing thermal clip of houses
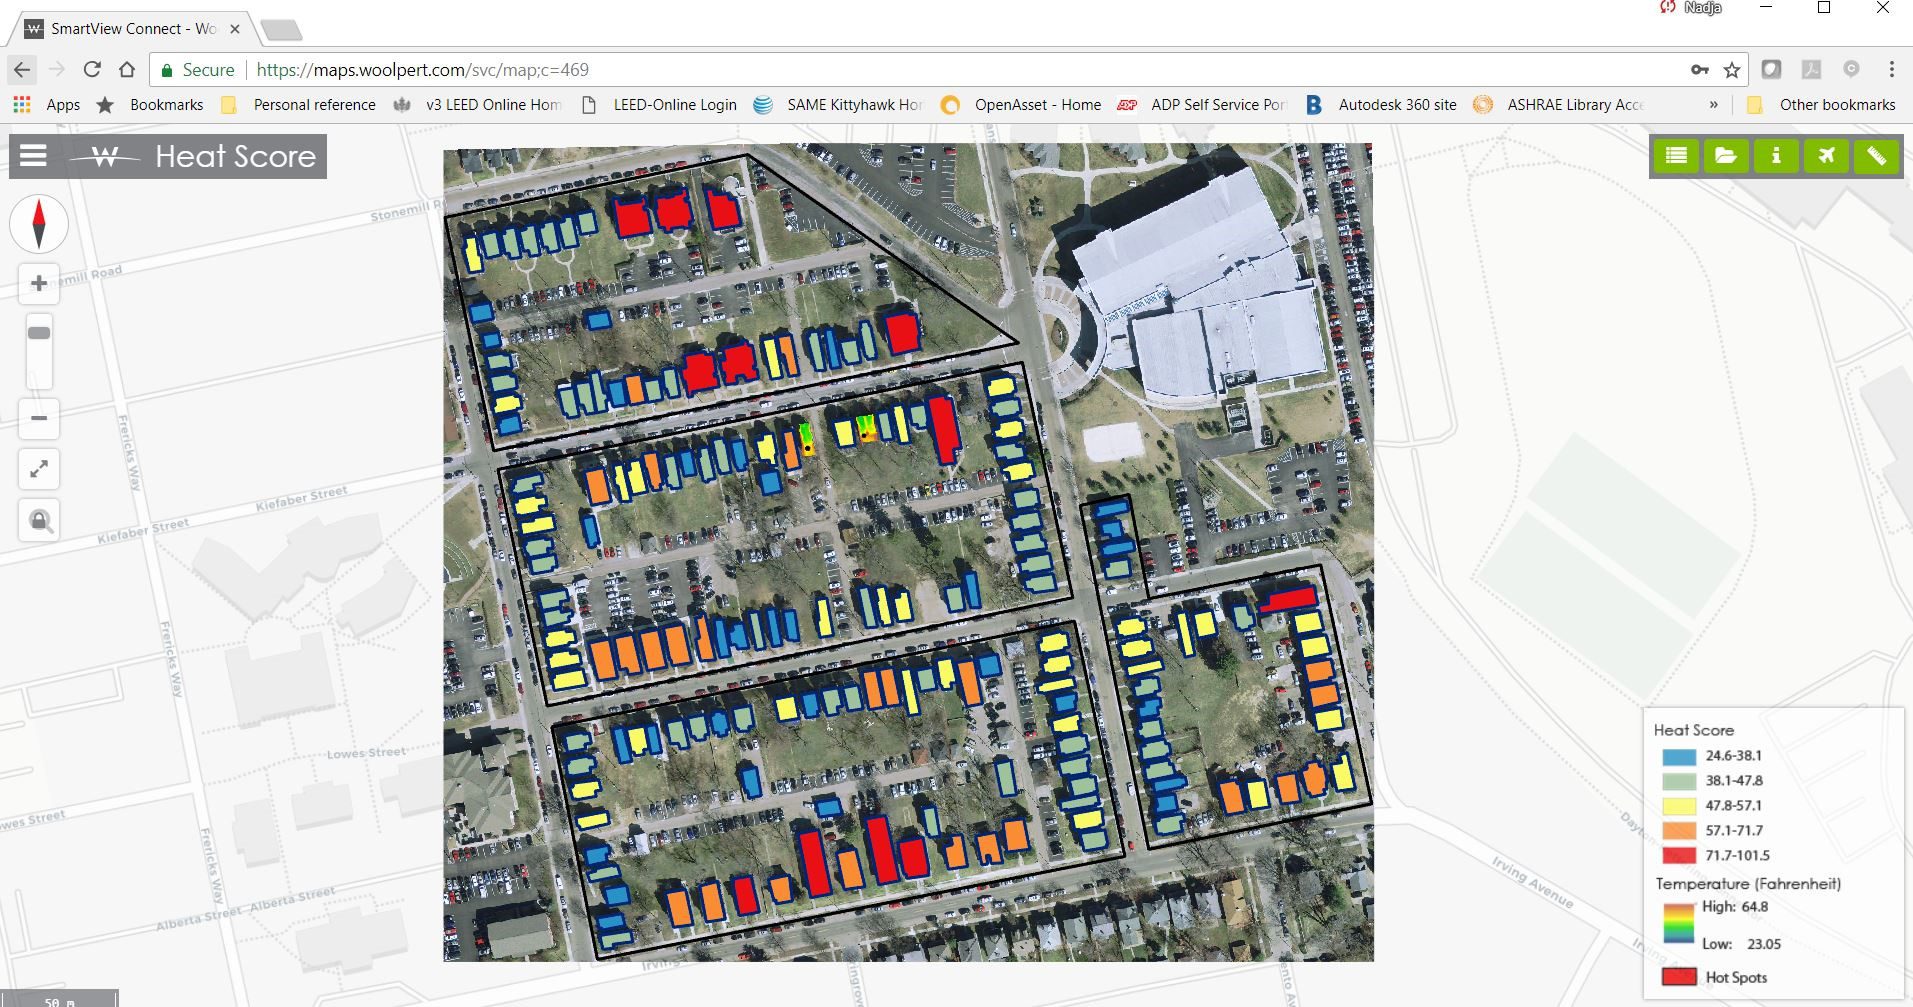
Figure 7: Woolpert’s HSM portal showing individual house heat scores
Each house in Figures 5, 6 and 7 is assigned a color, either cool (blue or green) for low heat loss or warm (red or orange) for higher heat loss. The HSM helps users visualize how their homes currently are and should be performing compared to other neighborhood homes. Heat loss translates to higher utility costs, and owners made aware of high energy losses are more likely to make fixes because they can see for themselves the impact of poorly functioning building envelopes. More specific thermal imagery, such as individual rooftop images and hot spot highlights, can further help owners address heat loss problems.
Case Study: University of Dayton
Challenge
Partnering with researchers at University of Dayton, Woolpert investigated changes to the energy auditing process occurring if thermal imagery replaced traditional boots-on-the-ground auditing techniques.
Approach
Before any imagery was flown or analyzed, historical data over the previous year was analyzed to establish trends, baselines and energy intensity for the various energy sources. As in a traditional energy audit, the team first conducted a utility bill analysis. Then, we used the historical data to perform regression analysis and determine the balance temperature for heating and cooling. Once weather and ground conditions were optimal, the team collected both nadir and oblique imagery to determine envelope values for the walls and the roof. The thermal imagery was collected at night to minimize thermal clutter, solar flux and reflection; it was paired with the plane's onboard GPS to create high-resolution, geospatially accurate thermal datasets.
Each building surface of the thermal dataset was isolated, and the minimum, maximum and average temperatures were determined using the typical emissivity for new metal roofing and siding. These temperatures were also calculated at higher emissivity values to simulate emissivity changes due to material aging/weathering. From an emissivity of 0.14 to 0.2, temperatures varied by roughly 4 to 5 degrees Fahrenheit. From an emissivity of 0.2 to 0.4, temperatures varied even more dramatically from 13 to 16 degrees Fahrenheit and demonstrated how reliant accurate temperature values are on correct emissivity values.
University of Dayton researchers developed a system of equations for determining the thermal resistance (R-value) of envelope components, walls and roofs, based on the material's exterior surface temperature. This process uses a dynamic model assuming an R-value to solve for a theoretical exterior temperature, compares it to the actual temperature, and then iterates until the error between the theoretical and measured temperature is near zero (this methodology is further explained in the paper Estimating Envelope Thermal Characteristics from Single Point in Time Thermal Images[3] by Salahaldin Alshatshati). Researchers inserted the Woolpert-collected temperature values into this model, and using various emissivity and corresponding temperatures, calculated R-values for the roofs and walls of a few buildings. The R-values ranged from 17.6 to 23.3 ft2 F/Btu, depending on the emissivity used. Wall R-values saw less of a variation based on emissivity and ranged from 20.4 to 23.5 ft2 F/Btu.
Outcome
Based on the analysis of the thermal imagery, it was determined that thermal imagery alone is not yet a viable and complete replacement for boots-on-the-ground energy audits. However, historical energy data coupled with thermal imagery can help prioritize the buildings for which boots-on-the-ground efforts will maximize the return on investment. Additionally, thermal imagery presents valuable potential for envelope analysis and identifying the roofs or walls with heat loss and insulation issues. As demonstrated, emissivity is crucial to providing accurate values for such an assessment, and as more data is collected on various material emissivity values, thermal imagery will become increasingly important for quantifying building envelope performance.
Conclusion
Thermal imagery is and has been an extremely useful tool for analyzing and inspecting building envelopes, above-ground and buried utilities, and mechanical and electrical equipment performance. It provides a layer of inspection of which the naked eye is not capable. Different collection vehicles add flexibility, offer cost-effective alternatives and provide the ability to scale collections. Qualitative analysis has long been the preferred method of analysis, but as emissivity values are more accurately defined, quantitative analysis will become more viable and add increased capabilities. The ability to obtain accurate R-values enables auditors to quantify the savings of building envelope improvements, which have traditionally been difficult energy savings measures to calculate. At the community level, the HSM is an incredibly valuable tool that provides individuals with specific information about how their buildings are and should be performing within their environments. Overall, thermal imagery is a diverse tool that benefits individual homeowners and campus facilities personnel alike. For utility workers, thermal imagery can save lives by accurately locating underground utilities. As the accuracy of thermal imagery increases, its value and applications will grow in step.
Works Cited
Abdullah, Q., McDavid, R., McKenzie, B., & David, D. Photogrammetric Approach to Aerial Thermal Survey, ASPRS Annual Convention, Tampa, Fla., May 2015
Hemachandran, Bharanidharan. Developing HEAT Scores with H-Res Thermal Imagery to Support Urban Energy Efficiency, MS Thesis, University of Calgary, 2013. Web. 06 August 2018.
Alshatshati, Salahaldin F. Estimating Envelope Thermal Characteristics from Single Point in Time Thermal Images, Dissertation, University of Dayton, 2017. OhioLINK. Web. 06 August 2018.
Authors
Qassim Abdullah, Ph.D., PLS, CP
Woolpert Vice President and Chief Scientist Qassim Abdullah has more than 40 years of combined industrial, research and development, and academic experience in analytical photogrammetry, digital remote sensing, and civil and surveying engineering. He is an ITC level II-certified thermographer. When he's not presenting at geospatial conferences around the world, Dr. Abdullah teaches photogrammetry and remote sensing courses at the University of Maryland and Penn State, authors a monthly column for the ASPRS journal PE&RS, and mentors Woolpert's research and development activities.
Nadja Turek, PE, F. SAME, LEED AP BD+C, GGP, Envision SP
Nadja Turek, a civil engineer and sustainable design expert, serves as Woolpert's sustainable design team leader. A former faculty member at the University of Dayton and the Air Force Institute of Technology, she engages in consulting, research, design and planning work. Ms. Turek works with teams of owners, designers, and construction professions, using technology to evaluate sustainable and resilient design alternatives and equipment choices.
[1] Abdullah, Q., McDavid, R., McKenzie, B., & David, D. Photogrammetric Approach to Aerial Thermal Survey, ASPRS Annual Convention, Tampa, Fla., May 2015
[2] Hemachandran, Bharanidharan. Developing HEAT Scores with H-Res Thermal Imagery to Support Urban Energy Efficiency. MS Thesis. University of Calgary, 2013. Web. 06 August 2018
[3] Alshatshati, Salahaldin F. Estimating Envelope Thermal Characteristics from Single Point in Time Thermal Images. Diss. University of Dayton, 2017. OhioLINK. Web. 06 August 2018
