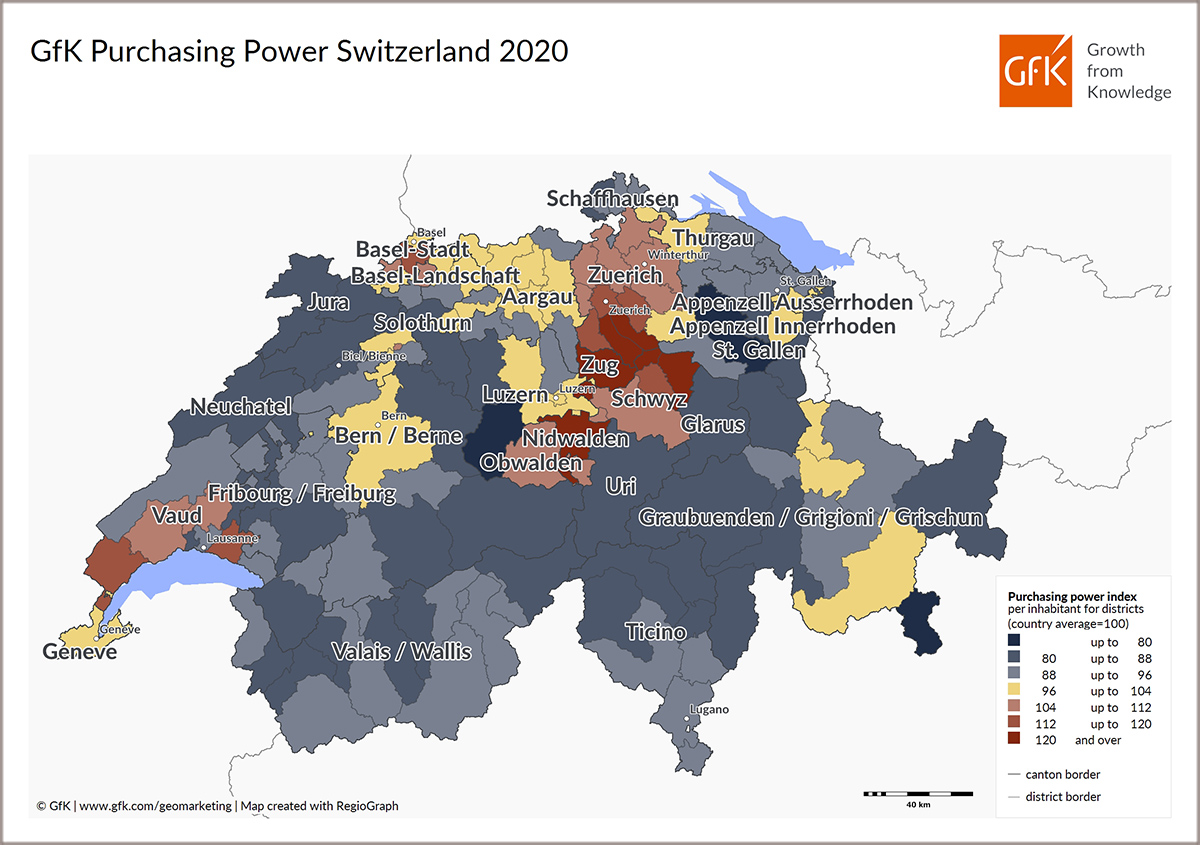
GfK’s Map of the Month for May shows the regional distribution of purchasing power in Switzerland in 2020.
According to GfK’s latest study for Switzerland, first place in the district rankings goes to the district of Höfe, where per capita purchasing exceeds the national average by +109%. Höfe is trailed by the district of Meilen (+51%), the canton of Zug (+46%) and the district of Küssnacht (+39%).
Purchasing power insights allow retailers, manufacturers and service providers to optimize their sales and marketing strategies based on regional market potential.
Download the map in high-resolution JPG format…
The map may be freely distributed and reproduced if the following attribution is included: “Illustration: GfK”.
