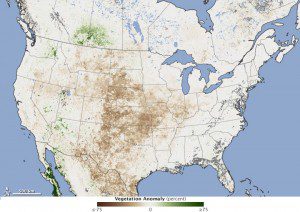
This map is based on the Normalized Difference Vegetation Index (NDVI), a measure of how plant leaves absorb visible light and reflect infrared light. Drought-stressed vegetation reflects more visible light and less infrared than healthy vegetation.
The browning and withering of U.S. and northern Mexico vegetation is clear in this vegetation anomaly map based on data from NASA's Terra and Aqua satellites.
Nearly two thirds of the contiguous United States was experiencing some level of drought by the end of August 2012, according to the U.S. Drought Monitor. 39 percent of the nation suffered from severe to extreme drought. Though the numbers changed a bit in mid-September, the drought parched much of the interior United States and left both domestic and wild animals scrounging for food.
The map contrasts plant health in August 2012 (the most recent full month available) against the average conditions between 2002 and 2012. Brown areas show where plant growth, or greenness, was below normal; greens indicate vegetation that is more widespread or abundant than normal for the time of year. Grays depict areas where data weren't available.
Image courtesy of NASA.

