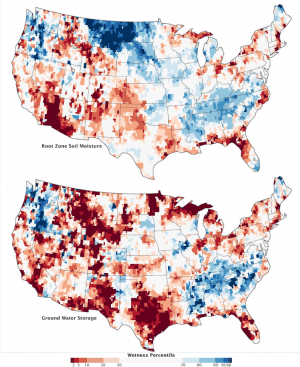
The top map shows the wetness or moisture content in the root zone”the top meter (39 inches) of soil. The bottom map shows water storage in shallow aquifers. The current water content is compared with a long-term average for early June between 1948 and 2009. The darkest red regions represent dry conditions that should occur only 2 percent of the time, or about once every 50 years.
Satellite data indicate North America's surface water conditions have improved in many places, but drought has persisted or deepened in others. Underground, the path out of drought is much slower.
In 2012, the continental United States suffered through one of its worst droughts in decades. Nearly 80 percent of the nation's farm, orchard and grazing land was affected in some way, and 28 percent experienced extreme to exceptional drought.
The accompanying maps combine data from the Gravity Recovery and Climate Experiment (GRACE) satellite mission with other satellite and ground-based measurements to model the amount of water stored near the surface and underground as of June 3, 2013. The maps are experimental products funded by NASA's Applied Sciences Program and developed by scientists at NASA's Goddard Space Flight Center and the National Drought Mitigation Center. They represent changes in water storage related to weather, climate and seasonal patterns.
Maps courtesy of the National Drought Mitigation Center at the University of Nebraska-Lincoln, NASA Goddard Space Flight Center and the GRACE science team.

