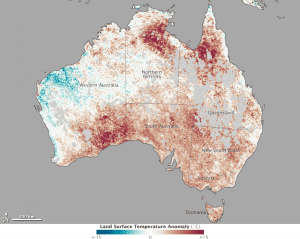
This map shows land surface temperature (LST) anomalies for Australia from Jan. 1 “ Jan. 8, 2013. LST anomalies show how much temperatures were above or below the average. The darkest reds show areas that were as much as 15°C (27°F) above the norm; blues show areas that were below normal; and grays depicts areas with incomplete data (often due to cloud cover).
Data from NASA's Aqua satellite depicts the January 2013 record-setting heat in Australia that lasted for weeks, mirroring a pattern that occurred in the continental United States during 2012.
Temperatures regularly eclipsed 45°C (113°F) in multiple locations across the continent. According to the Australian Bureau of Meteorology, Australia set a new record for the highest temperature averaged across the entire nation: 40.33°C (104.59°F) on January 7. The national average reached 40.11°C (104.20°F) the following day.
The overnight minimum temperature for January 7“8 also set new a record”32.36°C (90.25°F)”contributing to the hottest two-day period in Australia's recorded history.
Each of the first eight days of 2013 was among the 20 hottest days on record. The scorching weather continued a trend of four consecutive months (September to December 2012) where temperatures were the highest on record.
Image courtesy of NASA.

