 The third and final stage of our mobile mapping road trip reveals some of the benefits of the collected data.
By Joshua I. France, Riegl USA (www.rieglusa.com), Orlando, Fla., and Craig Glennie, University of Houston (www.uh.edu), Houston, Texas.
Our mobile mapping journey began with data acquisition along Interstate 95 in central Florida. We entered the point cloud to align and adjust it to match our survey control points. With that done, now we can begin the process of using the data to solve real-world problems.
Solving Design Projects
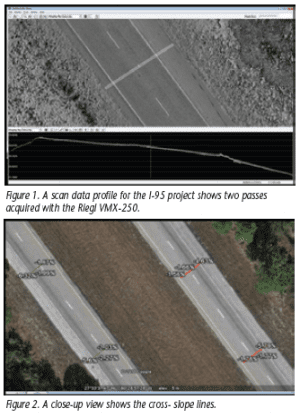
As detailed in Earth Imaging Journal's July/August issue, the Interstate 95 data (Figure 1) were collected for a paving company to use in its bid for a resurfacing contract. The data's engineering quality allowed a Riegl customer, DTS/EarthEye, to generate cross-slope information within one day of receiving the exported light detection and ranging (LiDAR) data (Figure 2).
Because the paving company had actual data tied to road conditions, it had the edge over the competition and won a contract with the Florida Department of Transportation (FDOT) to perform the work. The project also allowed FDOT to select a better design for current road conditions at a lower cost”a huge benefit to taxpayers.
Software Solutions
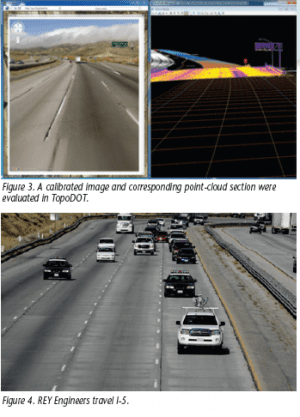
The point cloud was used to develop several types of solutions. For example, using Certainty 3D's TopoDOT software”an add-on to Bentley's MicroStation computer-aided design software”the design team extracted ground topography quickly, easily and accurately from point clouds and calibrated images (Figure 3). Break-lines, elevations, station cross-sections and other digital terrain model (DTM) components were extracted in MicroStation, according to project format requirements.
 TopoDOT is tailored to extract highway topography using a point cloud database management tool suite that accommodates any project size. Comprehensive data from the Riegl VMX-250 mobile scanning system was easy to post-process using these tools.
For a similar project, REYEngineers used TopoDOT to process 15 miles of I-5, a multilane highway in California (Figure 4). Extraction requirements for the project included standard topography break-line elements such as edge of pavement, ditches, curbs, bridges, drain inlets, etc. (Figures 5-9). In addition, surface elevations (3 x 10 ft2 grid on road, 3 x 3 ft2 grid on ground) and utilities (all signs, inlets, lights, guard rails, etc.) are required to be identified and extracted.
Using exported LAS files from Riegl's RiProcess software, the scan data can be brought into the TopoDOT environment. During the data export, the coordinates were transformed into California State Plane Zone 5 coordinates andU.S.survey feet by Riegl's GeoSysManager.
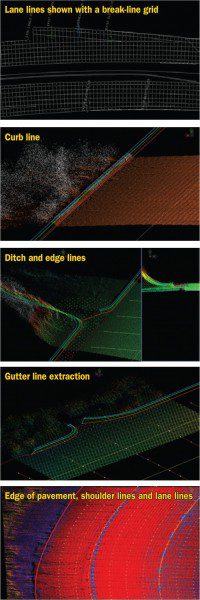
Figures 5-9. Extraction requirements for the project included standard topography break-line elements.
The files are a combination of the multiple passes split into 1-mile segments for north- and south-bound lanes. Each segment is independently registered to control with RiProcess as described in the last article, Entering the Point Cloud, which appeared in Earth Imaging Journal's September/October 2011 issue.
Data Management
The first step is to create a DGN file in MicroStation with control markings, mile markings, level structure and a cell library for the entire data set. Then the data are divided into four parts about 4 miles each”one for each processor in the team. The data are stored on a network drive where a processor can download the specific data required.
Each processor loaded his or her section to first check the registration quality. There are two independent quality checks performed before extraction begins. The first method used is a relative data alignment. The second method checks the absolute data alignment using control points.
Using TopoDOT's Cross-section byACS tool, the quality check is fast and effective. The software's Control to Data Analysis tool is used to check that the point cloud matches Global Positioning System (GPS) control points. In this process, the tolerance is set to 0.05U.S.survey feet (15mm) to flag control that falls outside this range and thus confirm the point cloud was registered accurately to control.
Basic Features
Next, the point cloud is ready for post-processing. The first step is to identify the best range of values for the intensity displayed. This makes the point cloud display more effective at identifying intensity-defined features, such as lane- or line-painted stripes.
Another useful display setting in TopoDOT is distance from plane to identify highest and lowest points from a surface. This is ideal for break-line extraction and ground processing.
 After the ideal display setting is selected, the first post-processing step is to identify an alignment line. Usually this line is created during planimetric design work. If it isn't available, it can be created using road-lane stripes.
TopoDOT uses the intensity range of painted stripes to provide a contrast to the pavement around them, allowing users to automatically extract the lines using the stripe extraction tool. This line represents the horizontal and vertical alignment needed to run the next processing tool.
The next processing step is to identify spot shots on the road surface to clean and smooth the DTM. This process uses the road extraction tool. Entering the station offset and point placement distance automatically extracts the road's alignment, spot shots, crown and peaks. In the I-5 case, the station offset was 10 feet, and the point placement was 3 feet from edge of pavement to edge of pavement.
 For this process, there's no need to remove any kind of noise from traffic, rain, etc., because the software is able to ignore such noise. Nevertheless, if there was a need to do this step first, it can be accomplished by using filter tools in RiProcess. Classification is also unnecessary, cutting down on post-processing time.
Another key feature of this tool is the spot shot placement, which is an average of the ground surface, not a particular point of the point cloud. This creates a more accurate surface model, because it cuts down the relative error of the low-noise Riegl VQ-250 laser scanners to 0.01 feet (a few millimeters).
Next, TopoDOT carries out break-line extraction of curves, gutters, and pavement and shoulder edges. For flatter break-lines, i.e., edge of shoulder, a quick extraction is done in plain view and draped over the data. To drape a line, users just need to specify the adjustment offset to the ground and the method of placement. For I-5, edge of shoulder and edge of pavement were draped at an interval of 10 feet.
For gutters and curves, the break-line extraction tool is used instead because it's more accurate for edge detection. To run the tool, a guideline close to the break-line is created so the tool can create cross-sections at specified intervals. The user can then place up to six points on the break-line profile.
For I-5, break-lines were created every 20-25 feet and on key points like inlets, arcs, etc. A profile is created by defining up to six points per cross-section”flow line, top of curve, back of curve, etc. Creating a profile is used to create a smooth break-line because it maintains the shape of the feature at each cross-section and interpolates missing points due to debris or vegetation along the curb. This tool requires more user interaction than others to identify the break-line features to improve the accuracy and reduce the time for rechecking the data.
Information Extraction
Additionally, TopoDOT offers tools to extract ground information on the interstate's surrounding areas. To identify surface information with vegetation, there's a ground processing tool with which a grid of specified dimensions is created at the lowest surface. For this process, vegetation doesn't need to be classified or removed, as the software automatically identifies the lowest surface and places a point. For the surrounding areas of I-5, a grid of 3 x 3 ft2 is used.
The grid points are added to the road surface model for water flow and drainage identification. Moreover, Riegl VMX-250 data provide enough point density to identify 2-D and 3-D topography assets and utilities like poles, traffic signs, drainage, etc.
If confirmation is needed to place a particular asset, processors can use Google's Street View images, which provide enough information to identify most assets. Pictures captured with the modularly integrated camera system VMX-250-C S6 can be brought into TopoDOT when collected with the dataset. California's cell library of utilities and signs is attached to final DNG files.
For the utilities and assets extraction, an asset identification tool is used. The user identifies the feature from an isometric view of the point cloud, and the tool creates a horizontal and vertical cross-section of the object at hand. The tool reads the object's dimensions, such as diameter, ground elevation and height. These dimensions are placed as text next to the symbol for the object. The cell contains the asset's symbol and attributes.
Finally, when each mile section of road is processed for all the features required, the data are merged and delivered in one-mile sections. A final quality-assurance/quality-control check is done at the merge stage to ensure no lines deviated from the point cloud data by creating a triangulated irregular network (TIN) surface mesh with Bentley's GEOPAK Civil Engineering Suite. This process allows the user to visualize the final product to ensure a smooth surface model. Any additional topography information from the DTM can be added by the end user.
Solving GIS Projects
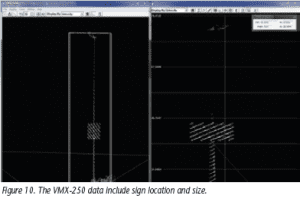
An inventory project in New York City collected signage information for 600 miles of highway (Figure 10). The size, location and type of sign are collected to create a complete catalog of signs for the municipal department of transportation, which can use the data to create a sign replacement program.
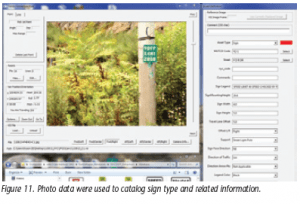
This inventory management program is required by the Manual on Uniform Traffic Control Devices, the standard for signs, signals and pavement markings in the United States. Mobile scanning, combined with photometric data acquired by a system such as the VMX-250, allows for a faster collection of this information and ultimately better data than traditional methods. A review of each sign can be done in the office whenever necessary (Figure 11). Although data storage may be a challenge, it's an easier solution than going to the site to take another look.
Mobile Mapping Equals Solutions
The emerging market for mobile mapping systems that combine LiDAR and navigation information continues to grow as more industries and government organizations find ways to use point cloud data. Users are finding more markets that are interested in the quality and quantity of information found in mobile-collected point cloud data.
Acknowledgements:
Thanks to everyone who helped to make these articles possible: colleagues at Riegl USA and Riegl Laser Measurement Systems, GmbH, as well as associates at Certainty 3D,REY Engineers and DTS/EarthEye. Their contributions were invaluable in creating this series on mobile mapping. .
Captions
Figure 1. A scan data profile for the I-95 project shows two passes acquired with the Riegl VMX-250.
Figure 2. A close-up view shows the cross- slope lines.
Figure 3. A calibrated image and corresponding point-cloud section were evaluated in TopoDOT.
Figure 4.REYEngineers travel I-5.
Figures 5-9. Extraction requirements for the project included standard topography break-line elements.
Figure 10. The VMX-250 data include sign location and size.
Figure 11. Photo data were used to catalog sign type and related information.

