By Waheed Uddin, professor of civil engineering and director, Center for Advanced Infrastructure Technology (www.olemiss.edu/projects/cait), University of Mississippi, University, Miss.
For years, transportation projects have benefitted from aerial photography and ground surveys for land parcel management, route location, topographic surveys, digital terrain modeling and contour generation. Today's infrastructure planners are fortunate to have a much wider range of tools at their disposal. Newer remote sensing technologies, such as high-resolution satellite imagery and airborne light detection and ranging (LiDAR), are being used to extract terrain elevations, create contour maps and locate infrastructure assets like road centerlines, bridges, culverts, signs and overpasses.
Such capabilities offer several advantages compared with conventional mapping methods. For example, data are collected and stored digitally, time is saved during data collection and analysis, more area can be covered, and data collection is subject to fewer topographic and weather operating constraints.
Spaceborne Satellite Imagery
The availability of cost-competitive, high-resolution, multispectral satellite imagery provides tremendous opportunities for analyzing infrastructure inventory, land use/land cover and traffic volume, as well as assessing environmental and post-disaster conditions. For example, satellite imagery was invaluable in quantifying Hurricane Katrina damage and associated economic costs in 2005. Figure 1 shows some examples of GeoEye's 1-meter IKONOS satellite imagery of Oxford, Miss.
Satellite-based imagery applications are particularly important for remote areas and developing regions where little aerial imagery is available. For example, as part of a recent intelligent transportation system project for Karachi, Pakistan, DigitalGlobe's 0.6-meter QuickBird-2 satellite imagery was used to help create road network and land use data for geospatial analysis. The satellite imagery presented a snapshot of road traffic density when the imagery was collected. Using a linear speed-density model and knowledge of 24-hour volume distribution, average daily traffic volume for the sample road section was calculated from traffic density. Based on statistically designed traffic sample sections, traffic volume maps were produced for Karachi's entire road network, which serves more than 14 million people. Additional geospatial analysis of the archived imagery can provide a unique opportunity to evaluate land use changes, traffic demand trends, disaster impacts and environmental sustainability.
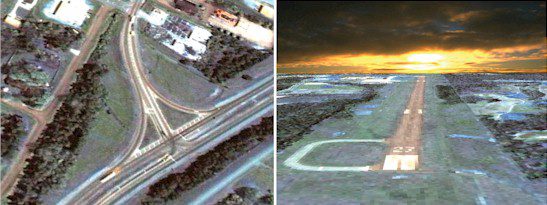
Figure 1. IKONOS 1-meter imagery collected over Oxford, Miss., in 2000; imagery collected over Gulfport, Miss., and New Orleans before and after Hurricane Katrina in 2005 was helpful for quantifying hurricane/flood damage and associated economic costs.
Airborne LiDAR
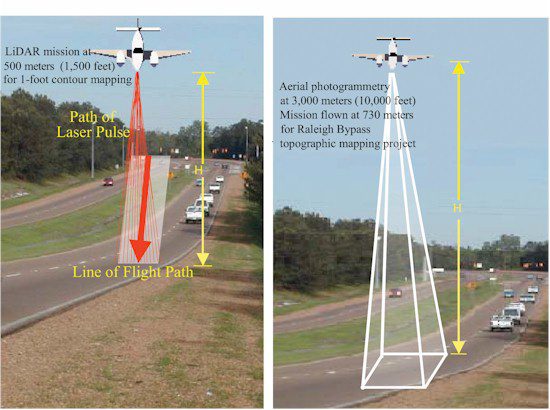
With the use of low-powered lasers and modern positioning instruments, airborne LiDAR technology has become a low-cost, time-efficient alternative for topographic surveys and terrain mapping projects (see Comparing Data Collection Technologies for Infrastructure Projects at right). LiDAR technology uses the near-infrared band of the electromagnetic spectrum and measures the time it takes for a laser pulse to travel from the transmitter to the target and back to the receiver. Because the light speed is known, the distance can be calculated. An accurate timing system is needed to guarantee the resolution, because the laser pulses are sent at 3,000 to 10,000 times or more per second. The aircraft positioning is recorded using an inertial navigation unit associated with avionics systems, a high-accuracy Global Positioning System (GPS) receiver in the aircraft, and GPS base stations installed in known locations. Thus, it's possible to determine 3-D georeferenced coordinates for each pulse and then correct the aircraft positioning in terms of roll, pitch and heading, thereby improving the system's accuracy. Modern LiDAR systems can operate at a laser pulse repetitive frequency of 50-100 kHz per second.
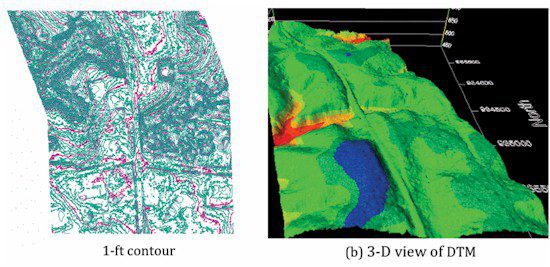
The Raleigh Bypass LiDAR data were used to develop 0.3-meter (1-foot) contours (left) and an accurate DEM (right).
Airborne LiDAR technology presents several advantages compared with traditional methods such as photogrammetry and total station ground survey. Data collection using the field survey can produce accurate information. However, this method demands a team to measure distances and angles in the field and is thus time consuming and expensive. Photogrammetry uses stereoscopic analysis of aerial photos to generate a digital elevation model (DEM) in the post-processing step, which can also be time consuming. Using LiDAR, time consumption can be reduced considerably because of the high data collection speed”up to 81 square kilometers or 20,000 acres per day, and the data are collected and stored digitally.
Infrastructure planners should keep the following considerations in mind when evaluating LiDAR and traditional data collection methods:
¢ Having a permanent photo record of the terrain is a clear advantage of traditional photography.
¢ LiDAR needs recent georeferenced imagery of the study area to identify the types of features and potential obstacles and to verify the objects automatically extracted from computational analysis.
¢ LiDAR isn't constrained by limitations of traditional photography relative to nighttime and certain weather-related operating constraints.
¢ Photogrammetry is more time consuming because of the intensive manual effort required for stereoscopic post-
processing by well-trained technicians.
¢ LiDAR survey data provide millions of 3-D points over the entire survey area compared with the extraction of elevation and features on discreet locations by stereoscopic photogrammetry.
¢ LiDAR is computationally efficient and less time consuming, but it also requires special
training.
Another unique characteristic of LiDAR is its ability to penetrate canopy vegetation. Although most of the pulses reach the vegetation canopy and are backscattered, there are points that go to the ground. This capability makes it possible to generate a bare-earth DEM by using software to remove the vegetation obstruction (points backscattered from the vegetation canopy). LiDAR measurements can archive DEMs with horizontal accuracy better than 30 centimeters (12 inches) and vertical accuracy of 15 centimeters
(6 inches) or less.
Diverse Capabilities
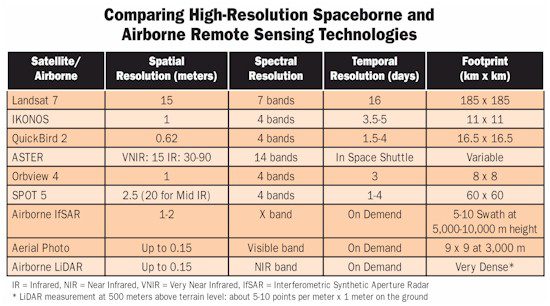
The table at left compares high-
resolution spaceborne and airborne remote sensing technologies. Combining different data sources can generate final products for multiple purposes, and these products can be easily stored and accessed by different users. Other useful applications of LiDAR combined with aerial/satellite imagery include 3-D mapping and urban infrastructure asset management, floodplain mapping, landslide and flood damage assessment, wetland inventory, forest type discrimination and canopy measurement for carbon capture monitoring.

