By A.J. Clark, president, Thermopylae Sciences & Technology (www.t-sciences.com), Arlington, Va.
Picture a spectrum. On the left is the old world of geo-spatial intelligence in which a satellite collects an image and sends it to a ground station. From there it goes to a database, where analysts clean it up with tools designed for the process. Then the image is stored in a library from which it can be pulled, analyzed again and used.
On the right is Google Maps with Google Earth, with a conflation of imagery and other data as well as spatial content tools to do things like tracking people or events in real time. This is where the answers lie, which is why 90 percent of the people who ultimately use geospatial intelligence reside there. They're used to clicking on Google or just looking at a map for their answers.
But are answers solutions? And what happens as data migrate from left to right, picking up more data and complexity with more tools to traverse the process?
As the geospatial community has tried to simplify data access for users, some of the data's value has become obfuscated and even overwhelmed by the process. Some questions can't be answered with simplified data. Even when they can be answered, questioners often are disappointed by answers that are oversimplified and incomplete.
You can search for places and things with Google Maps, but you can't query it to show you rock formations in the United States with certain types of mineral deposits. Emergency responders can ask where a fire is, but do they get a complete overview of the issues they'll face when they arrive to fight it?
How can the geospatial community take the value of geospatial intelligence beyond the place and time needed to show a fire's location? A good start is to be able to unlock all of the hidden analysis and information used to determine that answer, then anticipate and answer the next question. Users need to be able to go all the way to the left of the spectrum for the analysis, but to do so with the tools on the right to simplify access to the analysis and retain the data's completeness and value.
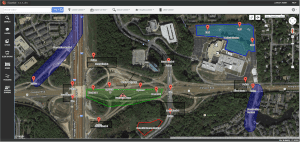
A Web-based, collaborative framework leverages Earth imagery and related geospatial information to help emergency responders solve complex problems.
Too Much Information?
Some users might say they want to know the location of the fire and the fire station, not how to build a fire truck. But when geospatial professionals add data that offer a more complete picture”particularly a picture with valuable information”then they have proven that simple isn't always better. How quickly can an assessment helicopter launch? How many fire trucks will it take to put out the fire at the warehouse”and deal with the forest on one side, the elementary school on the other, the nearby tank farm and its pipes running under the warehouse as well as the petroleum-hauling train that's due in an hour and the northeast wind that will start at 3 p.m. to fan the flames?
This often-complex mixture of static and dynamic data is necessary to make quick and meaningful decisions that can save lives as well as property. To glean the information to make quick decisions, interfaces need to be simple and easy to use. And it's important to offer a deeper look at spatial data and analytics to answer specific questions about specific jobs”but rapidly, so users can make the quick decisions they need to respond. It's not a matter of diminishing data. It's a matter of speeding up processes to use data more completely.
Developing a Workflow Solution
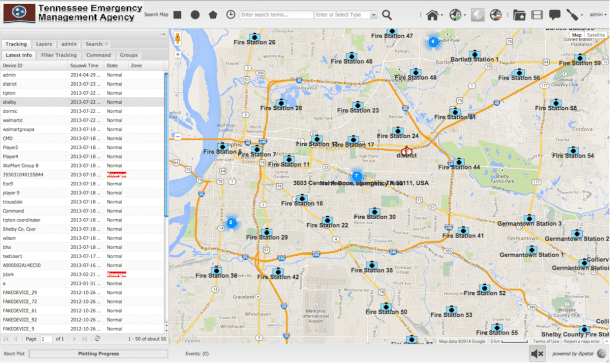
To make this vision a reality, Thermopylae and other companies are giving users access to a wide variety of geospatial data and designing technology to speed up data delivery, making it easier to leverage data by examining specific workflows”not cookie cutter, generic workflows. For example, building off Google Maps and Google Earth, Thermopylae's iSpatial software offers users a collaborative, browser-based tool to help them solve complex problems (see “Streamlining Emergency Response at the Tennessee Emergency Management Agency,” below).
A big part of the solution involves users knowing what data they want as well as what data are available. Simplifying data access entails democratizing spatial data in every sense of the word. As users gain access to multiple geospatial content sources, new questions arise, and the answers fuel an even greater need for information.
Gaining Momentum
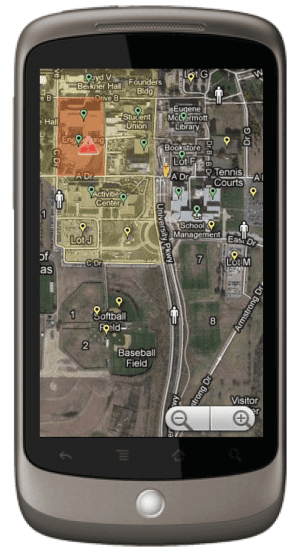
Adding mobile-sourced, georectified imagery to an emergency response scenario enhances the ability to collaborate with ground resources and provide up-to-date, relevant information.
In many ways, the military started rolling this snowball, and now it's gathering speed and mass with pushes from the public and private sectors. As the snowball expands, the geospatial industry is working with users to get them to realize what questions they need to ask to get answers that will help them solve their problems and create new opportunities.
Geospatial professionals are modeling algorithms to make the process and value of the results resemble the left side of the spatial data spectrum while applying new technology to make access to the data more like that on the right. Companies have learned to do some of this by using and watching Google.
For example, you can search and find out just about anything you want on the indexed Web. But when you find something by searching Google, you don't say, OK, I've got the full answer. The information you have helps you find an answer, which may lead to
another question. Eventually, what you find may be enough for you to take action.
If you search Google for the temperature in Sarasota, Fla., the search engine is going to circumvent some of the search process and give you an information card that says: The temperature at Sarasota, Fla., Tuesday at 9 a.m. is 76 degrees.
Google pulls together an aggregate of information to answer the question and simplify it. It doesn't send you to the Weather Channel's page or the National Oceanic and Atmospheric Administration's website.
Users want to do the same thing with geospatial content. But to do it, geospatial professionals have to abstract the deeply technical elements of such content. It's a matter of answering some questions: How much depth in the data is required to make an answer meaningful, and how can data be more user-friendly?
If all you want to know about Sarasota is the temperature, fine. However, if you're planning a two-week vacation there, you'd like to know if there's a hurricane forming that might spin through the Gulf of Mexico during the next 14 days.
Likewise, if you just want to know a fire's location, that's easy enough. If you want to know the issues around the blaze, you need more information.
The Time Is Right
The geospatial community wants to provide the more, and there's never been a better time to do so. The price of computing infrastructure has decreased and computing power has expanded, allowing geospatial professionals to rewrite their indexing strategies to provide meaningful answers to questions in seconds.
As a result, geospatial technology is increasingly able to answer the questions asked as well as predict future questions by modeling user behavior through shared data. It's a symbiotic relationship between front-end data visualization and back-end analytics that can help expand users' awareness of their own surroundings as well as activities within their own organizations and others.
For example, anticipating scenarios and responses can help emergency responders coordinate, rather than duplicate, efforts. Such anticipation lets users build dashboards of areas of concern that generate constant displays of useful information. By anticipating questions, innovative geospatial systems can save seconds in answering them, and seconds matter when lives are at stake.
The geospatial community is working to simplify users' processes right now. At the Port of Long Beach, Calif., for example, a new security system will offer an operator data from as many as 20 sources on one screen, with no more than three clicks on a computer mouse to call up video feeds, monitors, records and other specific data feeds.
During the next five years, deeper analytics across hyperdimensional big spatial data will be available to solve bigger problems more quickly. That's where geospatial professionals are going, with an evolutionary spectrum to guide them from left to right and back again.
Streamlining Emergency Response at the Tennessee Emergency Management Agency
The Tennessee Emergency Management Agency (TEMA) coordinates the state's emergency management response and recovery efforts to reduce loss of life and property. The agency coordinates its efforts by reaching out for mutual aid from other state departments or agencies, local jurisdictions, other states and the federal government. TEMA also manages the flow of material and special teams and services to incident commanders.
TEMA recently conducted an exercise to help improve its communication and efficiency for emergency response and coordination. A series of questions framed the exercise:
1. What are the benefits and drawbacks of modern Internet communication technology for a geographic information system (GIS)-based emergency management system?
2. What are the benefits and impediments of a GIS-based emergency management system across the operational, tactical and field echelons of the emergency response chain of command?
3. How does a modern Web 2.0 architecture address the limitations and impediments of using GIS for a real-time disaster decision-support system?
A Comprehensive Approach
TEMA enlisted Thermopylae Sciences & Technology, a company that specializes in Web-based geospatial capabilities, to run the three-day exercise by applying Thermopylae's iSpatial and Ubiquity product technology to simulated scramble response events across multiple counties. The GIS technology augmented the state's existing emergency management systems and the National Incident Management System with interactive and collaborative mapping capabilities used by state, district and county coordinators all the way down to multiple on-scene tactical response teams.
The exercise empirically and objectively assessed the feasibility, usability and benefits of emerging Web-based GIS technology to bolster rapid response operations during massive disaster events. In the process, TEMA and its partners created an easier, more intuitive and responsive system for mapping emergency information and providing new conduits for information sharing and collaboration. System capabilities included:
¢ Ingesting TEMA and related geospatial data sources from state and local data stores
¢ Fast, simple data creation for documenting and interacting with emerging information
¢ Geospatial layer export for simple sharing among GISs
¢ Screen sharing and slideshow collaboration tools
¢ Notifications and alerts using Ubiquity mobile connectivity from on-site users
¢ Multimedia and document association with map data
¢ Multitiered user accounts with differentiated access controls.
Emergency Response Simulation
The scenario chosen for the simulation required a highly coordinated response, including simulations of mutual aid in which multiple counties were involved. District and county coordinators worked with on-scene commanders and response teams called platoons to most effectively respond to the simulated disasters.
In the scenario, a tornado ripped through several counties and caused various types of damage, each necessitating its own set of responses; A University of Memphis dorm had an 11-floor tower partially collapsed, damaged and on fire; and a Walmart in Tipton county was reported to be 40 percent collapsed and 60 percent on fire. For the first 45 minutes, on-scene incident commanders in two different counties ran a scramble response, a high-stress period during which commanders execute immediate decisions to address short-term issues, quickly allocating and dispatching resources amid various distractions and situational developments.
For the dorm scenario, a complex Java-Script program simulated the search-and-rescue response, allowing each floor and room to be searched to see if students were trapped in that room. For this simulation, responders were told that 46 students were unaccounted for; the dynamic simulation went on in 3-minute increments, simulating students moving from floor to floor, trying to escape. Response teams used this for 45 minutes, trying to find and rescue the students in danger.
In traditional fashion, communication largely took place over radio, with field-response teams sending messages to incident commanders. In turn, commanders would make a decision to send more resources or otherwise respond. For example, responding to an explosion or injury, a commander might request emergency medical technicians. Then the request would be escalated to the district coordinator, who maintains an overview of each county and keeps a high-level view of the response operation.
The scenario was run once using traditional technologies and resources and once with the addition of iSpatial and Ubiquity. In the latter case, district coordinators were equipped with a large iSpatial monitor to show use across counties and track resource availability.
Effective Outcomes
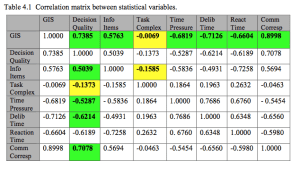
A multiple linear regression was used to assess statistical variables. Green cells reflect correlations that supported an initial hypothesis; yellow cells reflect correlations where a hypothesis was made but wasn't supported.
To measure the impact of iSpatial and Ubiquity, qualitative and quantitative data were collected. For the qualitative component, 27 survey respondents were considered, each having served a different role in the simulated scenario. Survey questions captured subjective sentiments related to the technology's overall usefulness and relative stress levels for each approach. The responses were plotted and analyzed, considering additional factors such as demographic, age, education and technology familiarity.
For the quantitative data, system usage logs were analyzed and compared. Participants' roles, communications, requests satisfied and data selected were captured and compared across the two versions of the scenario. In the control scenario, which leveraged traditional resources and relied on radio for communication and response coordination, the structure was hierarchical and required two radio bands to free the network and communicate clearly. However, in the scenario using iSpatial, radio traffic diminished as participants substituted iSpatial communications for many radio communications.
After all the data were collected, they were run through a multiple linear regression using various dependent and independent variables. Dependent variables were based on four hypotheses, and independent variables were based on task complexity determined by how many different pieces of information had to be used. The table above shows a correlation matrix between these statistical variables, with green cells reflecting correlations that supported the initial hypothesis and yellow cells reflecting correlations where a hypothesis was made but not supported.
Key variables measured in the simulations included decision quality, information items, time pressure and communication correspondence. Given the strong correlations between these variables and GIS use, there's a compelling case that iSpatial and Google Maps significantly improved the quality of decisions made and reduced the time and stress involved in making them.
Across all three counties sampled, the responses on the qualitative surveys were positive, especially in urban areas. Of the 54 survey responders, county and district coordinators reported the most benefit from GIS, as they could view the largest dataset and were able to see a more complete picture of the entire operation. In other words, the higher the user was within the command structure, the greater the benefit achieved with GIS.
Overall, the iSpatial/Google Maps system increased the amount of information a decision maker applied to critical decisions. This enabled emergency and incident response personnel to respond in a timelier manner with more effective decisions. Critical decision making during an emergency response was done faster and better, which translated to a direct correlation between the tool and reduced impact from the disaster.
Furthermore, the visual representation of operations and resources offered by iSpatial reduced the learning curve for emergency responders and reduced dependence on any one person or unit within an organization. Such information transparency and accessibility is critical for the long-term success of any emergency management team. Overall, Web 2.0-based geovisualization techniques improved the communication and information sharing process across the echelons of the emergency response chain of command.

