NASA Tackles Complex Data Challenges
The agency's EOSDIS program manages some of the most intricate and diverse datasets on the planet.
By Hampapuram Ramapriyan, assistant project manager, Earth Science Data and Information System (ESDIS), NASA Goddard Space Flight Center (GSFC); Jennifer Brennan, ESDIS user support and communications lead, ADNET Systems Inc., NASA GSFC; Jeff Walter, deputy project manager/technical, ESDIS, NASA GSFC; and Jeanne Behnke, deputy project manager/operations, ESDIS, NASA GSFC.
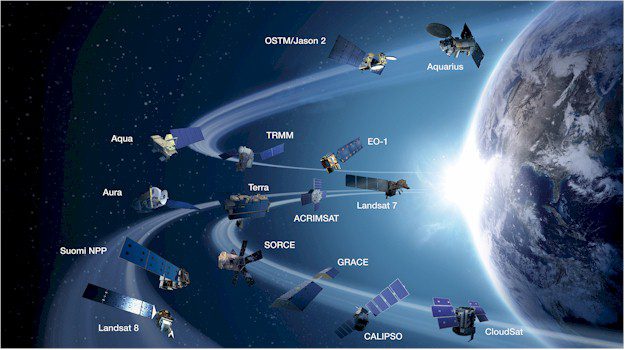
NASA's Earth Science Program comprises a series of satellites, a science component and a data system called the Earth Observing System Data and Information System (EOSDIS), which provides thousands of Earth science data products and associated services. Almost all data in EOSDIS are held online and accessed via ftp.
Exploring innovative approaches to extremely large datasets is of vital interest to NASA. One of the agency's most data-intensive activities is managing Earth science data, which is done through the Earth Observing System Data and Information System (EOSDIS). Today, dozens of satellites, airborne instruments and in-situ measurement campaigns contribute to the multipetabyte holdings in the EOSDIS archive. The data and derived products are available to users for free, according to NASA's free and open Data and Information Policy.
Examining Volume, Variety and Velocity
EOSDIS successfully manages a growing archive, which currently exceeds 7.5 petabytes. By today's standards, this volume of data is considered moderate rather than big. From a physical infrastructure perspective, the volume and data rates are manageable with currently available commodity technologies.
However, even power users with significant facility IT infrastructure, such as those at universities or other government facilities, may have difficulty accessing and analyzing large amounts of data. To help overcome such difficulties, it may be helpful to consider how the three characteristics of big data”volume, variety and velocity”apply to EOSDIS, then consider how some of the challenges have been met in the past and identify those that remain.
Regarding data volume and variety, the 7.5 petabytes of data held in EOSDIS archives serve many Earth science disciplines, including atmospheric science, land processes, oceanography, hydrology and cryospheric science (see http://earthdata.nasa.gov/esdis/earth-science-program/earth-science-measurements). The archives include nearly 7,000 unique dataset types. The EOSDIS user community”more than 1.5 million individuals”includes scientific researchers, operations agencies with near real-time applications, educational institutions and the general public.
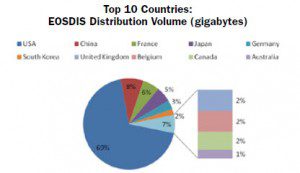
The velocity of data in EOSDIS can be expressed in terms of the growth of its archives (about 4 terabytes daily) and the flow of data to users (about 20 terabytes daily). In addition, data velocity is affected by data replacement, reprocessing, deletion, periodic media refresh for preservation, keeping up with changes in technology, etc. During 2012, EOSDIS distributed more than 630 million data files to users around the world (Figure 1).
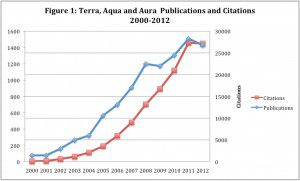
Another indicator of velocity is the growth of the metadata database. The number of records in this database exceeds 129 million and is increasing at an average rate of 66,000 per day. While such metrics indicate the magnitude of inputs and outputs, the value of EOSDIS to society can be measured by the scientific productivity resulting from the data (Figure 2).
Overcoming Complex Challenges
The major challenges facing EOSDIS today arise from the variety of data provided to the many Earth science disciplines represented in the data collection. EOSDIS data holdings are highly organized yet also extremely complex.
EOSDIS supports a centralized search-and-discovery capability that allows users to discover and access the data they want. In most cases, data are stored in structured files using a relatively short list of standard formats such as HDF, netCDF, GeoTIFF and ASCII.
The diversity and complexity of the data can pose significant challenges related to discovery, access and use for new and nonexpert users. The data span multiple scientific disciplines, contain myriad scientific parameters and often are organized into complex data structures with a wide variety of spectral, spatial and temporal resolutions as well as geographic projections. Other factors, such as the manner in which the data are acquired, stored and geographically distributed, can present challenges even for expert users who require data from multiple instruments or who are attempting to perform long time-series analysis.
Science instrument data from satellites are downlinked from spacecraft to either Tracking and Data Relay Satellite System (TDRSS) data relay satellites or directly to Ground Network sites”most often through X-band antennas. Once the data are downlinked, they're forwarded to a ground station at White Sands, N.M., where they're collected and transmitted to NASA's Goddard Space Flight Center and converted to base-level products.
These products are distributed to the agency's Distributed Active Archive Centers (DAACs) and 14 Science Investigator-led Processing Systems (SIPSs) via EOSDIS networks. EOSDIS networks are managed carefully to ensure interconnectivity among all elements of the system. The base-level products, along with ancillary data, are processed into higher-level products that comprise the standard products in the EOSDIS collection.
Various approaches are used to ingest and manage nonsatellite data, including in-situ ground- and ocean-based observations where data are collected at locations such as flux towers, buoys and site monuments. These in-situ measurements are transmitted to EOSDIS data centers via the Internet, physical media, direct collection from an instrument/satellite dish or some other direct path unique to the NASA science campaign.
Other EOSDIS inputs come from science instruments flying on NASA aircraft, such as Uninhabited Aerial Vehicle Synthetic Aperture Radar (UAVSAR) and Operation IceBridge. The data from these airborne instruments are captured on physical media and then delivered to the appropriate data center via networks.
Matching Data to User Needs
Given the variety of disciplines, user needs are diverse. To serve the different user groups, each of the DAACs has developed a set of specialized tools. There are more than 80 such tools covering five broad areas: search and order; data handling; subsetting and filtering; geolocation, reprojection and mapping; and data visualization and analysis (see http://earthdata.nasa.gov/data/data-tools). In addition, the DAACs provide expert advice on the use of their products and services through user services staff as well as answers to frequently asked questions on their websites.
EOSDIS also provides a cross-DAAC search-and-access capability to serve users who need data from multiple DAACs and/or don't know where data of interest are held. This is done using a central metadata repository called the EOS Clearing House (ECHO) and a search-and-order client called Reverb. NASA's Global Change Master Directory provides information about more than 25,000 datasets, including all of NASA's Earth science datasets as well as those from other agencies and countries. A comprehensive view of EOSDIS can be obtained through a cooperatively managed Web page at http://earthdata.nasa.gov.
EOSDIS also is committed to making scientific data products more relevant in the social-science context, so socio-economic data products are also a key feature of the system. EOSDIS organizes and transforms socio-economic data”e.g., gridded population maps”into forms more usable by Earth scientists and other interdisciplinary and applied users to support interdisciplinary data integration.
Other elements in the growing data asset base are legacy data from Earth science missions dating before EOSDIS was established or from completed missions whose data later were designated for incorporation. Given the size, scope and variety of data from EOSDIS, it's beyond the scope of this article to provide the full breadth of its applications. However, the sidebar below, EOSDIS Data Support Application Development, illustrates applications in three different disciplines.
Maximizing Data Delivery
During the last decade, NASA's research results and contributions in Earth system science have increased significantly, not only because of the breadth and depth of EOSDIS data holdings but also because of free, online data access. Although the DAACs support different scientific disciplines and provide an individualized set of products and services to their science community and the public, they also engage in common data management functions”ingest, archive and distribute”as well as describe their data and services on websites.
To best manage the volume, variety and velocity associated with NASA's big data efforts, each of the DAACs has a User Services Office designed to help various end-user communities select, obtain and use NASA EOSDIS data products. To continuously improve performance, NASA sponsors an annual independent customer satisfaction survey in conjunction with the American Customer Satisfaction Index. With scores in the high 70s, EOSDIS consistently exceeds the federal government's average score. The user comments received in the survey results are used to help define and incorporate data system improvements on multiple levels.
Tracing EOSDIS Development
Development on NASA's Earth Observing System Data and Information System (EOSDIS) started in 1990, when Congress approved the agency's Earth Observing System. Along with the agency's spacecraft missions and science investigations, it was considered essential to have a dedicated data system that would serve all the missions for the long-term benefit of the scientific and general user community. This project, called the Earth Science Data System Project, has been responsible for EOSDIS development and operation.
At the start of the project, the expected volumes, rates and varieties of data were overwhelming. For example, the data and derived products from Terra, the first in the EOS series of satellites launched in December 1999, was expected to double NASA's Earth science data holdings within a year. Data acquired from Terra in a single day would exceed an entire year's data from the Hubble Space Telescope.
Early on, two things became clear. First, the diversity of disciplines served required a distributed system involving organizations with specialized scientific knowledge in addition to expertise in data management. Second, as a long-lived system and given the rapid changes in information technology, the system had to adapt and evolve with time.
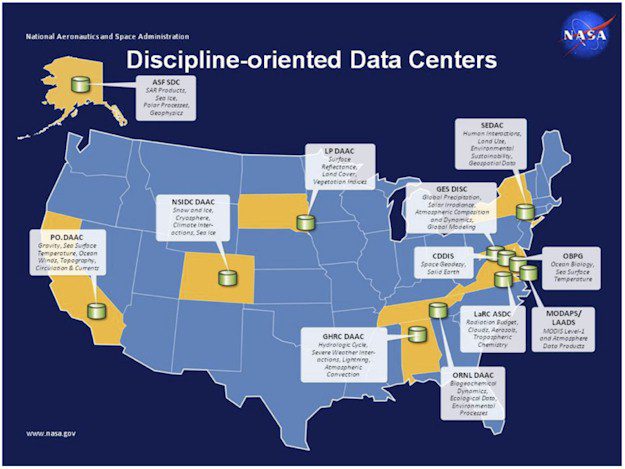
For example, when system development started, the World Wide Web didn't exist, and even the Internet wasn't widely used. Today, EOSDIS has evolved into a system of systems, consisting of 12 discipline-oriented
Distributed Active Archive Centers (DAACs) and 14 Science Investigator-led Processing Systems (SIPSs) that are distributed across the United States and connected via high-speed networks.
EOSDIS DAACs were established in 1990 and tasked with modernizing the Earth science data holdings with metadata and improving user access. The data holdings at the time came from many pre-EOS satellite missions, in-situ measurements from NASA's field campaigns and socio-economic data to complement the Earth science data.
A joint NASA-NOAA activity called the Pathfinder Program resulted in several key remote sensing datasets that were significant to global change research. This program ensured that such datasets were scientifically validated, consistently processed and made available to users.
In August 1994, the DAACs were declared operational along with a cross-DAAC search capability called the Version 0 Information Management System, providing one-stop shopping for EOSDIS holdings. Starting with the launch of the Tropical Rainfall Measuring Mission (TRMM) in 1997, in addition to maintaining the previous holdings, EOSDIS has been processing, archiving and distributing data from all of the EOS satellites. It archives and distributes data from nearly 50 different missions, involving more than 90 instruments.
The DAACs are responsible for archiving and distributing the data and providing user services. The SIPSs are responsible for processing data from scientific instruments aboard the EOS satellites and delivering the processed data products to the DAACs. Each DAAC specializes in a set of Earth science disciplines and archives products appropriate to its discipline(s).
Recent additions to data sources for EOSDIS archives include the Suomi National Polar Partnership mission, a series of aircraft flights constituting the Ice Bridge investigations, Making Earth Science Data Records for Use in Research Environments (MEaSUREs) Program, and five separate aircraft investigations in the Earth Venture Program. NASA plans to use EOSDIS for archiving and distributing data from several future activities, including Decadal Survey satellite missions.
EOSDIS Data Support Application Development
The Earth Observing System Data and Information System (EOSDIS) provides data products to many users within three hours of observation using the Land and Atmosphere Near-real-time Capability for EOS (LANCE). This capability is useful for a variety of time-critical application areas such as hurricanes, volcanoes, floods, fires, oil spills, dust storms, air quality, snow and ice, and weather. Some of these applications are highlighted in the following sections.
Studying Wildland Fires
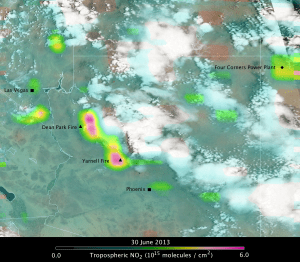
A June 30, 2013, image displays enhanced tropospheric nitrogen dioxide column amounts associated with the Yarnell Hill Fire in Arizona. The data were collected by the OMI flown on NASA's Aura satellite and are shown overlaid on a MODIS image acquired by Aqua during the same timeframe.
Data from multiple NASA Earth-observing satellite sensors can be used to study the relationships between environmental factors and fires. The unique view from space allows wildfire and disaster management teams to better monitor fires and understand their impacts. NASA's Moderate Resolution Imaging Spectroradiometer (MODIS) instrument, onboard both the Terra and Aqua platforms, acquires data twice daily. These daily MODIS fire observations advance global monitoring of the fire process and its effects on ecosystems, the atmosphere and climate.
For example, to better assess atmospheric conditions during the Yarnell Hill Fire on June 30, 2013, the Ozone Monitoring Instrument (OMI), a Dutch-Finnish instrument flown on NASA's Aura satellite, collected tropospheric nitrogen dioxide (NO2) data that were combined with MODIS true-color data to create the image at left. The unusually high NO2 column amounts near the fire indicate that on this date the fire was burning combustible material at a very high rate. The intense heat of the fire also could have transported NO2 to higher altitudes in the atmosphere where OMI was better able to detect it.
The MODIS image shows a line of thunderstorms that developed just to the east of the fire. The storms have been identified as a primary meteorological factor occurring on June 30 that created wind shear conditions leading to the tragic deaths of 19 firefighters who were battling the wildfire. Strong thunderstorms of this type can produce powerful low-level winds, which may have caused the fire to flare up, move quickly and even suddenly reverse direction. Pink colors indicate elevated NO2 in the atmosphere. The line of thunderstorms that created the dangerous wind conditions can be seen just east of the location of the Yarnell Hill Fire (black triangle), which occurred about 1.5 miles west of Yarnell, Ariz.
Tracking Severe Storms
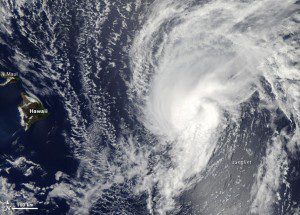
Despite the close proximity at the time this MODIS image was captured, data released by the National Weather Service suggest that the center of Flossie never made landfall, but came close to Kauai in the early morning hours of July 30.
NASA satellite data measure key parameters related to tropical storm energetics and development such as sea surface height, sea surface temperature, surface air temperature, humidity and near-surface winds. Used synergistically, the data can lead to a better understanding of tropical cyclone dynamics.
The MODIS instrument on NASA's Aqua satellite acquired the accompanying image of Tropical Storm Flossie at 1:10 p.m. local time on July 28, 2013. At the time the image was captured, Flossie had sustained winds of roughly 60 miles per hour (50 knots or 90 kilometers per hour).
Assessing Temporal Change
Monitoring the locations and distributions of land-cover changes is important for establishing links between policy decisions, regulatory actions and subsequent land-use activities. For example, analyzing spatio-temporal change in vegetation cover and its density is vital to understanding the impact of climate change on biodiversity and exploring options for minimizing its affects.
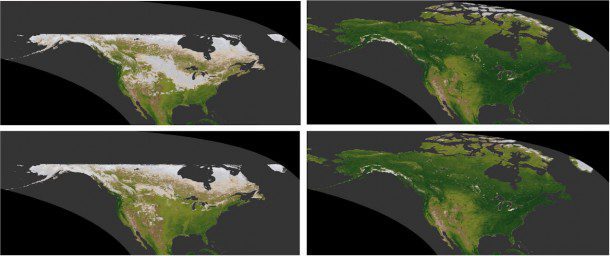
The top-left and bottom-left images portray dormancy during 2001 and 2012, respectively. The top-right and bottom-right images describe the growing season conditions during 2001 and 2012, respectively. The 2012 dormancy period is striking in terms of the decreased snow cover compared with the conditions in 2001.
In recent years, much research has been conducted regarding Normalized Difference Vegetation Index (NDVI) response relationships to vegetation and climate change. NDVI is a simple numeric indicator that can be used to analyze remote sensing measurements and assess whether the target being observed contains live green vegetation or not. The two pairs of images below describe the Terra MODIS-derived NDVI for North America during the dormant and growing seasons for 2001 and 2012.

