By Kevin Corbley, principal, Corbley Communications (www.corbleycommunications.com), Castle Rock, Colo., and John Stenmark, principal, Genesee Communications (www.geneseecomms.com), Golden, Colo.

The TREES-3 project will allow scientists to develop better forest cover maps at regional scale and locate rapidly changing regions. Shown here are cover change measurements in Brazil from 1986 (top) and 2003 (middle) and the change between the two dates (bottom).
The Landsat Data Continuity Mission (LDCM), scheduled to launch in February 2013, will play a critical role in the long-term success of TREES-3, a global forest-monitoring project initiated by the European Commission's Joint Research Center (JRC). The LDCM satellite, which will be operated by the U.S. Geological Survey (USGS), will help JRC and its partners track worldwide changes in forest cover well into the next decade.
Spearheaded by researchers at theJRCfacility in Ispra, Italy, the project provides scientific support to the Forest Resource Assessment of the United Nations Food and Agricultural Organization (FAO), according to Frederic Achard, TREES project leader. A primary goal is to accurately determine current rates of forest loss throughout the world's tropical regions for comparison with future forest-cover changes.
Everyone has a gut feeling that rainforests in Indonesia and Brazil are in trouble, but when we actually try to quantify this and compare them with other parts of the world, it's surprising how sparse our information is, says Alan Belward, head of JRC's Land Resource Management Unit and Landsat Science Team member. That's where TREES-3 comes in.
The LDCM satellite, which is being built by Orbital Sciences Corp., will have data acquisition capabilities nearly identical to its Landsat predecessors (see Inside the Landsat Data Continuity Mission, Earth Imaging Journal, July/August 2012), enabling the systematic measurement of global increases and decreases in forested lands with a high level of accuracy.
Tracking Forest-Cover Change
On a global scale, forests are key factors in the climate system because they regulate energy exchange on both sides of the equation. Through absorption of carbon dioxide, trees serve as carbon sinks. Deforestation, however, reintroduces carbon into the atmosphere, resulting in a significant net increase.
In one fell swoop, you lose your sink and add emissions, explains Belward. Deforestation accounts for some 15 to 20 percent of carbon emissions, but we know little in detail about where and when forest-cover change occurs.
Beginning in 2007, TREES researchers obtained Landsat images acquired in 1990 and 2000 and were archived at partner ground stations. The team segmented Earth's tropical land surface into 4,000 sample sites, one every 1 x 1 degrees. Automated land-cover classification techniques then used the Landsat spectral bands to classify the type of forest cover in each image.
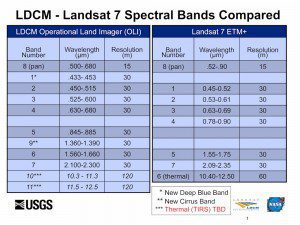
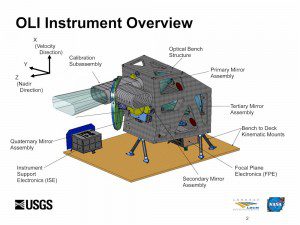
OLI will collect images in nine wavelength bands, including new bands for cloud detection and coastal and aerosol studies.
Due to limited funding, the TREES project faced a challenge in obtaining consistent data sets. Researchers often had to use whatever Landsat images were available from 1990 and 2000 archives at partner sites, creating variations in data quality. In 2008, USGS announced it would distribute Landsat data for free via the Internet.
Free data was a huge positive factor for us, notes Belward. We've been careful to go back through the USGS archive and select optimal images from 1990 and 2000.
Web-enabled Internet access also gave TREES a jumpstart on its collection of 2005 data. With greater consistency in image quality and conditions among images and between acquisition dates, the accuracy of the project's forest classification and percent-cover calculations has improved. This will enhance the overall quality of TREES measurements as the project moves into its next stage of comparing images collected during the three initial analysis years.
In addition to applying automated change detection methods, the project relies heavily on local teams from around the world. They are helping to verify that forest change as interpreted in the Landsat imagery is actually occurring on the ground. Images from NASA's Moderate Resolution Imaging Spectroradiometer (MODIS) sensor flown on two satellites, Terra and Aqua, are also helping to validate the Landsat interpretation.
By comparing forest cover from the 1990, 2000 and 2005 Landsat data sets and ground truthing, we have a benchmark of deforestation rates, explains Belward.
These benchmarks will be essential to carbon emissions monitoring and trading in the future, he added. In future years, JRC will rely on the LDCM imagery for comparison with the three data sets being built now. The imagery will help scientists quantitatively determine where deforestation has slowed or accelerated.
No-Cost LDCM Data
USGS plans to include LDCM data in its free Web-enabled data delivery program. Data from the new satellite will be available from the existing USGS Web portal at http://glovis.usgs.gov or http://earthexplorer.usgs.gov.
LDCM imagery will be delivered in GeoTIFF format, and most commercial software packages already work with the 12-bit data from the satellite's Operational Land Imager and Thermal Infrared Sensor (see LDCM's Technology Advantage, below). USGS will integrate and register images from the two sensors into a single data product for end users. A new benefit for geographic information system (GIS) operators will include a three-band full-resolution product. The full-resolution 8-bit images are intended as background or context images for use inGISor similar applications.
As a result of the LDCM satellite's many improvements, forested areas can be imaged more frequently to capture different stages in leaf cycles, and desert regions can be imaged at longer intervals.
The NASA and USGS teams developing the mission are excited about the coming acquisition and distribution strategies designed to improve the temporal richness of the global data archive for the TREES-3 project as well as the thousands of additional applications requiring medium-resolution multispectral satellite imagery.
LDCM's Technology Advantage
The Landsat Data Continuity Mission (LDCM) has been designed from the ground up to enable optimal synoptic, seasonal, medium-resolution multispectral observations of Earth's land surface. The satellite's carefully planned technology upgrades ensure data collection that's consistent with previous Landsat missions.
LDCM Innovations
The satellite will carry two separate spectral imaging devices. The primary sensor is the Operational Land Imager (OLI), which is being built by Ball Aerospace & Technologies Corp. Based on technology demonstrated on the Earth Observing 1 (EO-1) mission launched in 2000, OLI will collect images in nine wavelength bands, including new bands for cloud detection and coastal and aerosol studies. In addition, LDCM will carry a two-channel Thermal Infrared Sensor (TIRS), which is being built by NASA Goddard Space Flight Center. According to Jim Irons, NASA project scientist for LDCM, the added thermal channel provides advantages over Landsat 7's single channel.
The two spectral bands enable more accurate correction for atmospheric effects in the thermal bands, he says. That provides a more accurate retrieval of surface temperatures than with a single band.
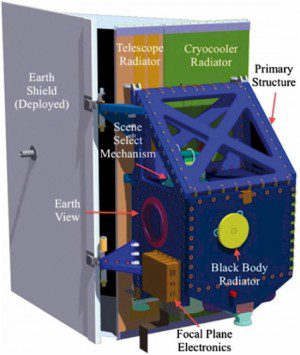
TIRS will measure land surface temperature in two thermal bands with a new technology that applies quantum physics to detect heat. Click on image to enlarge
John Dwyer, LDCM project scientist at the U.S. Geological Survey (USGS), described a key LDCM improvement. Landsat 7 data are quantized at 8 bits for pixel for each spectral band, he explains. Data from OLI and TIRS will be quantized at 12 bits per pixel. That's a huge advancement in radiometric sensitivity.
Push-Broom Benefits
OLI and TIRS use push-broom sensor technology, a major departure from the whisk-broom approach on earlier Landsat spacecraft. In a whisk-broom sensor, a mirror oscillating perpendicular to the satellite's travel path creates the cross-track dimension of an image by directing incoming light onto spectral detectors. The satellite's forward motion over Earth provides the image's long-track dimension. Because the satellite is moving, the detectors capture a curved path as the line of sight sweeps along the ground. A scan line corrector resolves the sweep effects that naturally result as the mirror oscillates and the satellite moves.
In LDCM's push-broom design, arrays of more than 6,000 detectors per spectral band are aligned across the instrument's focal plane, perpendicular to the satellite's direction of travel. The response from the detectors forms the cross-track dimension of the images, collecting an entire image line at once. The forward motion of the spacecraft and resampling of the detectors create the long-track dimension.
Because the push-broom detectors can dwell longer on the energy coming up from each line, the signal-to-noise ratio can be much higher than the whisk-broom approach. This gives the imager a wider dynamic range and more sensitive response to radiation changes. As a result, LDCM data will be more sensitive to change and will allow more accurate retrieval of land cover and land cover condition than could be achieved with Landsat 7.
In 2003, Landsat 7's scan line corrector failed, forcing operators and users to find workarounds or alternative data sources. Dave Hair, USGS project manager for LDCM, pointed out a key benefit of LDCM's push-broom approach. Overall we have fewer moving parts, he says, and we don't have the sweeping component of the moving mirror. So there are fewer mechanical problems that could occur.
The OLI and TIRS spectral bands are consistent with historical Landsat data, with the new blue and cirrus channels included in response to requests from Landsat users. The higher signal-to-noise ratio of the push-broom sensors makes it possible to narrow the spectral bands and move them away from atmospheric absorption features, thereby reducing sensitivity to atmospheric changes.
According to Dwyer, OLI's panchromatic band is substantially narrower than that of Landsat 7. It will provide better spectral contrast over land surfaces, so you can use it with other spectral bands for image sharpening or color composite images, he says.
Landsat images are georeferenced and attitude-corrected. LDCM will use attitude sensors, star trackers and onboard Global Positioning System receivers to determine the attitude and location of the OLI and TIRS sensors. The sensors will be thoroughly calibrated prior to launch and at regular intervals while on orbit. LDCM will routinely use ground control to ensure consistent geometric corrections and scene-to-scene accuracy over time. LDCM will return to Earth approximately 400 images every day, each covering a swath 185 kilometers wide.

