By Daryl Madden, director of advanced concepts, Overwatch Geospatial Solutions (www.overwatch.com), Sterling, Va.
Not long ago, Earth imagery analysts were starving for data and happy to find a panchromatic image of their area of interest. Today, the volume and variety of imagery has grown exponentially and will expand even further as a host of unmanned aircraft systems (UASs) and smallsats come online.
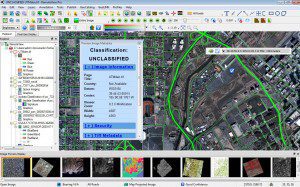
Analysts use a combination of integrated georeferencing tools, geoconfidence indicators, imagery preview panels, information bars and assistance panels to control and analyze imagery and associated data.
Sensors and image formats currently used for full-spectrum geospatial intelligence (GEOINT) include panchromatic, multispectral, hyperspectral, infrared, synthetic aperture radar (SAR), light detection and ranging (LiDAR), moving target indicators, motion imagery and wide-area imagery. Modern geospatial software seamlessly integrates all of these imagery types, enabling image analysts to locate features and extract valuable information such as activity-based intelligence that analyzes the events, movements and transactions within an area to discover connections among people, things and places. At each step, sophisticated algorithms can improve and expedite performance.
Importing Imagery Data
Today, importing an image typically requires connecting to large databases, often via application programming interfaces. In recent years, the Open Geospatial Consortium has developed Web services”such as the Web Map Service, Web Map Tile Service and Web Coverage Service”that have increased the number of ways in which analysts can connect to data sources. These image formats, compression types and metadata formats change constantly.
Geospatial software must be able to ingest every type of geospatial data file, regardless of its size, storage location, format and metadata format as well as the procedures required to open it. For example, Overwatch's RemoteView geospatial analysis software handles more than 43 different types of image formats. In addition, geospatial software must decompress these files and extract the metadata.
Georeferencing, a cartographic process, aligns geographic data to a known coordinate system so the data can be viewed, queried and analyzed with other geographic data. For example, a standard JPEG image that includes no georeferencing data can be georeferenced if the coordinates of an object within it are known.
Advanced GEOINT software packages incorporate georeferencing algorithms to automate this process. Depending on the type of image format and the metadata within the format, obtaining a geographic readout often can be accomplished simply by dragging a cursor over an image.
Another key automated process for aerial or satellite imagery is orthorectification, which corrects the geometry of an image so it appears as though each pixel was acquired from directly overhead, using elevation data to correct terrain distortion. Then the software can interpret and represent the geographic information in several ways, such as the four corner points of the image, a sensor model, a rational polynomial coefficient or a replacement sensor model.
Image Visualization
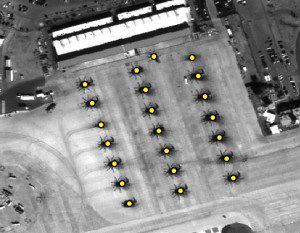
Here geospatial analysis software automatically detects a helicopter squadron within large-area satellite imagery.
It's critical for imagery analysts to be able to roam an image quickly, smoothly and continuously”including zooming, panning and rotating”at rates of more than 1,000 pixels per second. Any type of jitter, no matter how small, is unacceptable, because it causes analysts to lose track of their place on the screen and can lead to motion sickness and headaches.
LiDAR point clouds and even panchromatic images now come in huge files that are compressed (the latter often in the JPEG2000 standard), using numerous configuration parameters. Geospatial software processes data through the iteration of sophisticated algorithms that look at each step along the way, including disk access, network access, graphics processing unit, central processing unit, and imagery and memory management.
The best software packages even use predictive analysis, which helps users organize data from the onset of collection. Processes designed to read the data in their native format and get them to the screen as quickly as possible must consider the fact that most users have limited time and disk space to preprocess the data.
Many different factors affect image processing, including network latency, processor speed, the computer's memory and the type of graphics card it uses. Minimum hardware specifications, including reasonable bandwidth for networked environments, help to ensure the best processing capabilities.
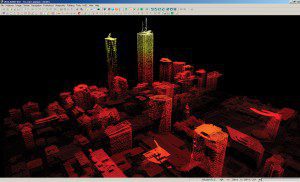
Often imagery analysts want an angled, or oblique, view to measure a shadow and determine a structure's size. The problem is that doing so makes it harder to achieve geoaccuracy. This problem can be solved by combining elevation data with the imagery to quickly create a 3-D visualization, which allows users to add models”such as extruded buildings, cars, people or planes”and virtually fly through an area.
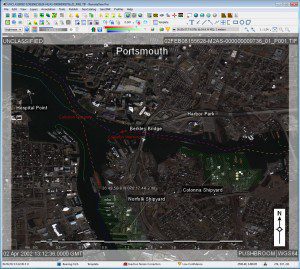
Templates can display information such as an image's title, a North arrow, the date and time the image was collected, and text and symbols that identify areas of interest.
Achieving high-quality imaging requires a full understanding of the imaging chain, a modeling concept that helps engineers design and build imaging systems. Therefore, in addition to reading the pixels from the image format, geospatial software must analyze the entire image chain.
By combining high-speed processing chain technology with a carefully refined user interface, such software can boost productivity on large images, videos and data sets. Federal agencies test the software against a specification, such as the Softcopy Image Processing Standard, to ensure the picture on the display is the highest quality possible.
Exploitation and Analysis
Analysts must be able to find items and areas of interest within imagery files as large as 30GB, whether using a default search pattern; following a feature, such as a river; or drawing a line or a polygon as a search area. Geospatial analysis software can automate such tasks as finding all items of interest”for example, planes or landing zones”within large images.
Image metadata, another incredibly useful tool for geospatial analysts, embeds within imagery geographic tags as well as a date and time stamp, title and the type of sensor used to collect it. Such data may be automatically parsed from the image file rather than requiring the user to dig through the metadata to find them.
Some software packages include shortcut keys and templates to automate the application of metadata during the analysis process. For example, an analyst may wish to always use a template that displays an image's title, a North arrow, the date and time when it was collected, and the type of sensor used to collect it.
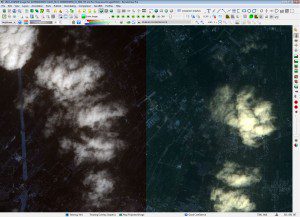
Pan-sharpening capabilities allow analysts to display enhanced details of an original multispectral image (left).
To accomplish this, the analyst may create a custom template that automatically applies this information to an image when creating a report. In this case, the template will always go to the metadata, pull out that information and display it so the user doesn't have to continually find the information within each image or enter it into each report.
Analysts must be able to perform numerous imagery analysis phases, which differ greatly depending on the mission or objectives they support. Geospatial software partly automates these tasks based upon each image's metadata, using algorithms ranging from four corner points to regular sensor models.
Analysis also can involve determining fields of view or lines of sight. With line of sight, an analyst picks two points and asks whether one is visible from the other; the program will display the elevation profile between those two points. A field of view is the area that an observer, such as a sniper, could see around his position.
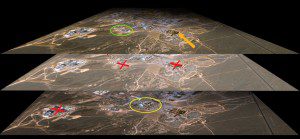
One key type of analysis is comparing images of the same area taken at different times, and often by different sensors, to find features and detect changes. One way is to put images side by side, separated by a vertical line”for example, images from a month ago on the left and from yesterday on the right”then move the line horizontally to see the changes. Other comparison methods include blending the two images, flickering back and forth between them a few times per second, or detecting changes by displaying old features in red and new ones in blue.
Yet another way to compare multiple images”for example, images of a particular location taken every month”is by building an image stack and displaying the images sequentially like a movie. This enables analysts to quickly and easily identify changes that have occurred over time without having to individually study each image.
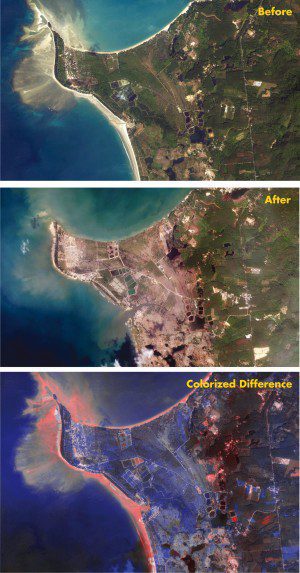
This sequence of images displays software capabilities for automated change detection and color coding to highlight areas of change after a tsunami.
GEOINT software packages include the ability to automatically align different images of the same area. For example, such software can automatically pull in images taken before and after Hurricane Sandy, stack them and geoalign them to the exact pixel based on the metadata.
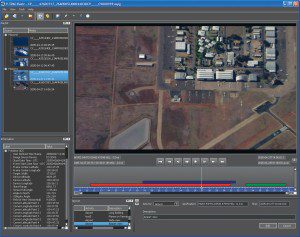
With the growth of UASs as essential resources for surveillance and reconnaissance, requirements are emerging for integrating motion video analysis tools with the GEOINT software packages analysts use every day. For example, V-TRAC, a RemoteView extension, leverages core competencies in photogrammetry, file management, visualization and reporting to provide a complete video exploitation tool that analysts can use for all phases of video analysis. The product supports report generation and mission planning through an integrated video player, a report editor and image editing tools. By integrating such tools with geospatial data stores, analysts are able to search archived videos by location or time and then delve into mission sets to exploit useful information.
Finally, top-of-the-line geospatial software also allows users to mosaic, or stitch together, an unlimited number of images and create a giant mosaic as well as to annotate 2-D images, 3-D images and video frames. An imagery analyst's daily tasks include a variety of requirements for imagery enhancement and visualization. Powerful image processing and visu-alization tools provide analysts with capabilities that are ideal for contrast and brightness control, independent component analysis, sharpening and haze control, dynamic range adjustment, image resampling and stereo viewing to enhance imagery and gain perspective.
Some GEOINT software packages offer selectable sharp-ening filters, sophisticated resampling algorithms, tonal transfer curves for optimal contrast display, automatic and manual dynamic range adjustment and haze removal. Monitor and printer cali-bration capabilities also ensure that data quality remains through the entire analysis process.
In addition, multispectral analysis capabilities enable users to quickly and easily analyze and interpret data collected from modern sensors, including panchromatic, color, infrared, multispectral, hyperspectral and radar. Both supervised and unsupervised image classification wizards enable users to quickly identify and analyze signatures in an image”such as heat from an engine, special chemicals or camouflage”with-out having to undergo months of training. These tools also include algorithms for vegetation analysis and to delineate land and water boundaries.
Threshold tools let users quickly identify and move past areas within imagery, such as cloud coverage or ocean coverage, for which there is no need to perform analysis. These time-saving tools enhance performance and streamline decision making for time-sensitive analysis.
Millions of analysts rely on accurate geospatial imagery to support applications ranging from military intelligence to monitoring climate, ecosystems, erosion and urban planning.
More advanced geospatial analysis software packages provide users with tools that guide them through precision positioning workflows to select images; sample ground points; and generate accurate, precisely placed image markers. Such advanced tools dramatically reduce the work necessary to acquire precise positioning and coordinates. They also may include automated report-generation functions that enable users to produce complete precise positioning products on the fly.
At times, analysts can combine images to use the best qualities of each type of sensor. One method is pan sharpening, an algorithm that combines the higher resolution of a panchromatic image with the color of a multispectral image to produce an enhanced-resolution, multispectral image. In other words, pan sharpening colorizes a panchromatic image.
Production and Reporting
At times, analysts need to capture a small portion or subset of an image to create a report. This is called chipping. For instance, an analyst reporting on a location devastated by Hurricane Sandy may start with a large image of the region taken immediately after the disaster, but he or she may be interested only in portions of the area”such as a port or a building.
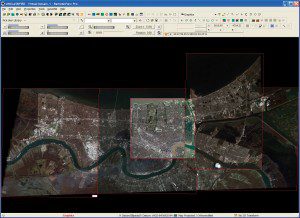
Geospatial analysis software was used to create a large orthorectified virtual mosaic of New Orleans.
To cut out the relevant portion of the image and chip it, the analyst will bring up the image, find the area of interest, draw graphics on it and put a template on it”perhaps a white box with a title, a North arrow, the group's logo, any metadata associated with that image, and an arrow and call-out boxes. Using integrated publishing toolsets, the analyst then can publish the chip and all associated information automatically to PowerPoint or a PDF template for presentations and briefings.
Alternatively, an analyst can chip an image directly to Google Earth and have it displayed on that platform. In addition, the analyst can chip out a piece of an image to a GeoPDF, a PDF file with geographic information created by TerraGo (www.terragotech.com) as an enhancement to Adobe Acrobat's PDF format. Then any computer that has Adobe Acrobat Reader with the TerraGo extension can read that GeoPDF file, displaying both the image and the geographic information it contains.
Overwatch's 3D Pro software extension to RemoteView also provides analysts the ability to publish and share large interactive 3-D scenes in 3-D PDFs through integration with the PDF3D SDK from Visual Technology Services (www.pdf3d.com). To chip through an image stack, such as a multispectral image over a panchromatic image, an analyst could draw a box around a location that changed over time and chip through each of the images to produce several reports. This process is called coring.
Expanding Options and Expectations
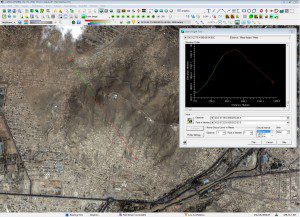
Geospatial analysis software performs line-of-sight analysis of a 2-D image. The green line represents the visible field of view, and the red line represents the obstructed field of view. Elevation data within the dialog box provides accurate details for both the visible and obstructed fields of view.
Applications for imagery data are growing, as are users' expectations. Increased reliance on full-spectrum GEOINT for critical safety and security decisions depends on high pixel-level accuracy and precision as well as robust, highly scalable systems. Ingesting, managing and analyzing imagery and creating useful, accurate and timely reports requires increasingly sophisticated software that automates the process as much as possible while leaving the analyst in control. Top-of-the line geospatial analysis software greatly increases the analytical capabilities of organizations of all sizes and provides a high return on their large investment in imagery data.


