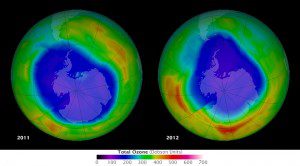
The images above represent the typical method of gauging the ozone hole. They show the extent (the geographic area covered) and the depth (the concentration of ozone from top to bottom in the atmosphere) as measured by Aura's Ozone Monitoring Instrument. Blues and purples represent the lowest ozone levels. Each image shows the day of maximum extent”when the ozone hole was largest that year.
The holes in the ozone layer over Antarctica in 2011 and 2012 are a study in contrasts. The 2011 hole ranked among the 10 largest recorded since the 1980s, whereas the 2012 hole was the second smallest.
But an area view doesn't tell the whole story, as it says nothing about the chemistry or atmospheric dynamics that give the hole its shape. And if we don’t know why the size and depth of the hole varies, it is impossible to know if policies meant to reduce ozone depletion are having an impact.
The Antarctic ozone hole forms in the southern spring when chlorine and other ozone-depleting chemicals interact with sunlight to destroy ozone. It would be easy to assume that a larger ozone hole means more chemicals were present, but the real picture is more complicated.
Image courtesy of NASA.

