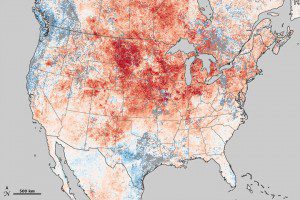
Areas with warmer than average March temperatures are shown in red, near-normal temperatures are white, and areas that were cooler than the 2000-2011 base period are blue.
The intensity and scope of the heat wave is clearly visible in this map of land surface temperature anomalies. Based on data from the Moderate Resolution Imaging Spectraradiometer (MODIS) instrument on the Terra satellite, the map depicts temperatures compared with the average of the same eight-day period of March from 2000-2011.
Records aren't only being broken across the country, they’re being broken in unusual ways. Chicago, for example, saw record-breaking temperatures above 26.6° Celsius (80° Fahrenheit) every day between March 14-18. For context, the National Weather Service noted that Chicago typically averages only one day in the eighties each April.
Additionally, only once in 140 years of weather observations has April produced as many 80° Fahrenheit days as this March. Meanwhile, Climate Central reported that in Rochester, Minn., the overnight low temperature on March 18 was 16.6° Celsius (62° Fahrenheit), a temperature so high it beat the record high of 15.5° Celsius (60° Fahrenheit) for the same date.

