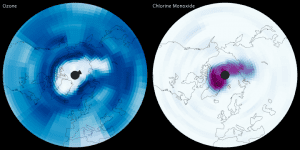
The left image shows high ozone concentrations over most of the planet, but low concentrations”the ozone hole”over the Arctic. The right image shows the concentration of chlorine monoxide, which is concentrated over the Arctic where the ozone hole developed.
In March 2011, NASA's Earth Observatory published images of a rare, deep depletion in the ozone layer over the Arctic. The images came from daily observations made by the Ozone Monitoring Instrument on NASA's Aura satellite. A new study, published in Nature, uses a companion instrument on Aura, the Microwave Limb Sounder (MLS), to describe how and why the event looked a lot like the annual Antarctic ozone hole.
MLS looks through the edge of Earth's atmosphere to measure gases, in this case ozone and chlorine monoxide, one of the most dominant ozone-destroying gases. The two accompanying maps were made with data collected by MLS on March 18, 2011. In both cases, high concentrations of the gas are dark, while low concentrations are light.
Image courtesy of NASA.
View a slide show of additional images from the Aura satellite.

