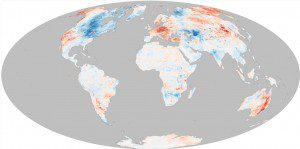
This map puts the North American winter in wider context. On a global scale, land temperatures for the December through February period were actually the 10th warmest in the modern record, according to NCDC, 0.87°C (1.57°F) above the 20th century average.
For many North American residents, the winter of 2013-2014 seemed like one of the coldest in many years. Waves of Arctic air brought extended periods of cold weather and above-average snowfall to the middle and eastern portions of the United States and Canada. Seven Midwestern states had one of their top-10 coldest winters, and the

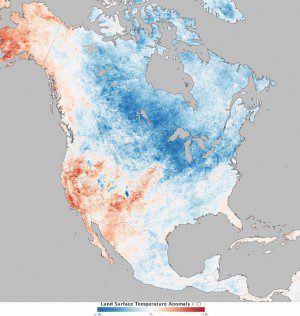
The winter of 2013-2014 wasn't as cold as one might think”only the 34th coldest on record. Areas with warmer than average temperatures for December 2013 to February 2014 are shown in red, near-normal temperatures are white and areas that were cooler than normal are blue.
Great Lakes were chilled until they reached nearly 91 percent ice cover. Even portions of Mexico and Central America were cooler than normal.
But human memory isn't a scientific measure, and long-term perspective tends to get lost in casual conversation and news coverage. The winter of 2013-2014 followed two winters that were significantly warmer than the norm, which likely made this season feel worse than it was. Researchers at the U.S. National Climatic Data Center (NCDC) reported that the average temperature of the contiguous United States for the winter was just 0.4° Celsius (31.3° Fahrenheit), about 1°F below average.
Why was it only the 34th coldest winter in 119 years of records? Because most of the land west of the Rocky Mountains was warmer and drier than average, so those warmer temperatures offset the cold snaps to the east. California had its hottest winter on record, and several other states came close. Though it isn't included in the contiguous U.S. measurements, Alaska also thawed in spring-like heat and rain that melted snow and ice.
The map at left shows land surface temperature anomalies for North America for Dec. 1, 2013, to Feb. 28, 2014. Based on data from the Moderate Resolution Image Spectro-radiometer (MODIS) on NASA's Terra satellite, the map depicts temperatures for December 2013 to February 2014 compared with the 2000“2013 average for those months.

