Geospatial data users are leveraging oblique imagery for a range of innovative applications.
By Art Kalinski, GISP, former GIS manager for the Atlanta Regional Commission and geospatial military projects consultant, including consulting for Pictometry International Corp.
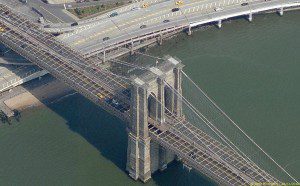
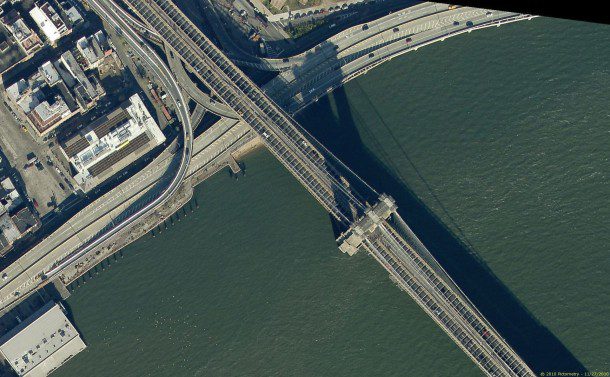
A limitation of orthoimagery is that it can take a trained analyst to understand what the imagery shows. Above is the Brooklyn Bridge in ortho and oblique views. Note how quick and easy it is to recognize the bridge in the oblique image.
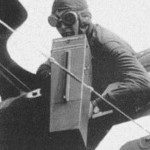
Early aerial reconnaissance efforts in the 1920s consisted of shooting oblique pictures from the open cockpit of a biplane with a hand-held Graflex camera (Figure 1). After landing, the film was processed and analysts did the tedious work of extracting actionable intelligence from the imagery. Analysts soon learned it was a nightmare to assemble the trapezoidal-footprint oblique photos into a mosaic.
The straight-down view of orthoimagery and perfectly square or rectangular footprints were much easier to assemble into a mosaic. Geographic information system (GIS) technology only reinforced this ortho-centric approach because most GIS software is designed to work with rectilinear view data and imagery. However, it took highly trained photogrammetrists to decipher the orthoimagery and a long time for the information to get into the field. So for decades we've been stuck in this ortho world.
Technology Advances
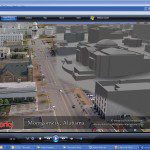
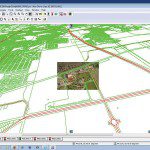
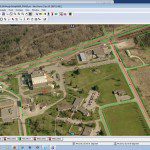
The convergence of new developments in optics, digital imagery, Global Positioning System (GPS) technology, inertial navigation systems and computers now permit efficient capture of oblique imagery. The new oblique imagery is also precisely measurable and accurately georeferenced so GIS data can be accurately overlaid on the images. The easily perceived imagery also includes powerful measuring and analysis tools that are changing the nature of visual intelligence for tactical use (Figures 2-4).
Metric oblique imagery has been in use since 2001. Unlike a traditional orthoimage, metric obliques provide overlapping oblique imagery from four cardinal directions plus an orthoimage. Another advantage of shooting imagery from multiple directions is the effect of sun angles, which highlight details that normally wouldn't be visible with orthoimagery.
 The photos, taken from low-flying aircraft, are clear and positionally accurate becauseGPSand inertial navigation systems are used during the computerized capture with a 66 percent overlap from each direction so every spot on the ground generally appears in at least 15 images. Because no ground resources are needed during the capture, the imagery can serve as a georeferenced base map on which to register other sensor data. If local elevation data are available, they can be used to tighten the accuracy of the images. Additionally, the process is fast and efficient because it's computerized from capture to final delivery.
 Typical county projects result in thousands of overlapping five-way images. Managing those images would be difficult if not for the viewing and analysis software provided with the imagery. The software, which easily can be learned by users with no GIS experience, manages the imagery, imports GIS data, and overlays the data on the ortho and oblique imagery.
The software also has tools to accurately measure length, width, areas, angles, irregular distance, ground elevation and, unique to oblique imagery, the heights of objects in the image. Additionally, GIS data layer attributes can be queried, the images can be annotated, and the annotation can be saved as Esri Shapefiles for inclusion in the user's GIS.
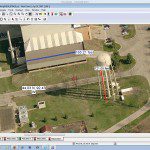
Figures 2-4. A progression of screen shots shows GIS vector data re-projected and overlaid on an oblique image. Zooming in, one can see the alignment of the GIS data and finally the ability to measure horizontally and vertically.
Integration with traditional GIS applications, such as Esri's ArcGIS, was difficult but is now relatively easy thanks to the work of Pictometry and Esri software engineers (Figure 5). Because Esri software only accepts rectilinear data, a system was devised to re-project the trapezoidal footprint imagery to an ortho footprint. This was done by stretching the image to remove the perspective while still maintaining the oblique view and the ability to measure heights. This conversion can be accomplished with a tool that's also part of ArcGIS Image Server.
Imagery Innovation
Steve Schultz, Pictometry's chief technology officer, explained the difference between an orthomosaic and an oblique mosaic.
Through the ortho-rectification process, analysts make every pixel a uniform square in terms of dimension on the ground. This means that measurements can then be made with a ruler and the resulting measurement multiplied by the photograph's scale (e.g., 1 = 100') to get the resulting ground measurements. This doesn't work for oblique images because each pixel in the image has a different size and scale than all other pixels in the image due to the constantly changing perspective.
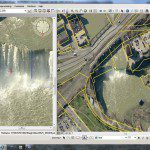
Figure 5. Screen shots show two methods of integrating oblique imagery into the ArcGIS environment. On the left is a transformed oblique image with overlaid GIS data in the map window; on the right is a zoomed-in oblique image of the same location.
Even with computer processing of a GIS, the methods for determining positions and measurements on an oblique image were too computationally expensive to be able to do that ˜live' on images being viewed by analysts. Instead, images were rectified to a grid through a long batch process, and then the resulting ortho-rectified images were fed into a GIS.
According to Shultz, it wasn't until Pictometry came up with a computationally efficient way to georeference oblique images that analysts could use native images for GISpurposes. Instead of warping the image to fit the grid (i.e., the ortho-rectification process), Pictometry essentially warps the grid to fit the image (i.e., the Pictometry process). When done, each pixel is fully georeferenced, allowingGIS data to be overlaid, locations to be extracted and distances to be measured. Moreover, because of the 3-D aspect of the oblique view, heights can be measured as well.
The ability to accurately measure objects in the imagery is possible because of a patented process that scientifically captures the geographic location of each pixel in each image. This rich dataset permits even more sophisticated analysis and processes beyond just simple measurements, including the fast creation of interactive 3-D models (Figure 6).
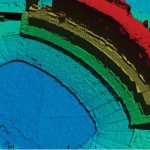
Figure 6. A reflective surface model of a ball field was created using only oblique imagery”no other elevation data were used. Note the clean edges and detail that wouldn't be visible using traditional LiDAR point sampling techniques.
Such models are a natural extension of oblique imagery because they're derived from the imagery and provide even more versatile tools for rapid visual perception. Because the location of each pixel is known, a 3-D model can be derived from multiple images, similar to old stereo pair analysis.
Once the surface model is created, the same imagery that was used to create the model is draped as a photo-realistic and photo-accurate skin (Figure 7). The models can be created in any popular format, and, because the process is semi-automated with computer processors doing most of the work, model generation can be done in hours.
The detail and accuracy of roofs and other features in such models would be difficult even with easy tools such as Google Sketch-Up. Because the models are rapidly created using computers, the time and, therefore, cost is one-tenth of that using traditional 3-D creation tools. Consequently, the models are an affordable acquisition.
Such 3-D models have been used extensively in U.S. Army Tactical Terrain Visualization System (TTVS) helicopter and mission planning and rehearsal simulators (TopScene) built by Lockheed Martin. Additionally, 3-D viewers such as Skyline's Terra Explorer take advantage of these georeferenced and fully measurable models because the viewer understands the topology and building geometries.
One of the most refined examples of the integration of GISand 3-D models from oblique imagery in an interactive Web service is Virtual Fairfax (www.fairfaxcounty.gov/gis/virtualfairfax). Tom Conry, the Fairfax County GIS manager, started using metric oblique imagery in 2001.
According to Conry, planning meetings have been significantly more efficient with Pictometry oblique imagery and PLW Modelworks 3-D models. They help politicians and the public understand the issues without the tedious learning curve needed for most to understand locations and subject issues. This proved especially valuable in communicating a massive Tysons Corner transportation reconstruction.
Says CW4 Tom Wilson of the Army TTVS helicopter mission planning and training simulation center, When 3-D models are fused together with imagery and elevation data, they allow Army Aviation to rehearse missions in a virtual environment prior to actual execution. The increased situational awareness brought forth by rehearsing within a 3-D terrain database enhances our probability of mission success.
In a recent Request for Information (RFI), the National Geospatial-Intelligence Agency (NGA) indicated it might be preparing to meet requirements submitted by many federal customers. Specifically the RFI states the need for 3-D modeling, full-motion video, 2-D, 2 ½-D, 3-D and 4-D visualization.
The RFI additionally states, Oblique (˜Multiview') imagery collection shall at a minimum provide for 0 to 40 degree angles in the four cardinal directions, and a nadir view, with at least 15-cm resolution at the midpoint of the view angle.
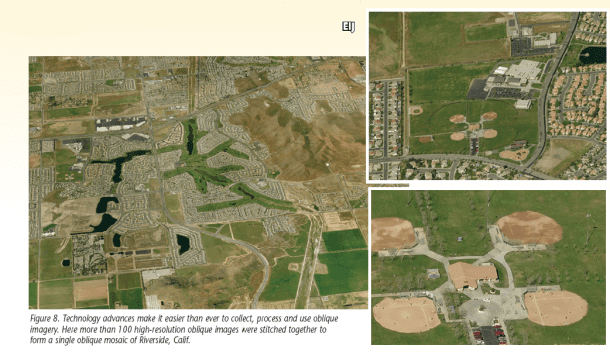
Getting back to the original oblique mosaic problem, the early nightmare of mosaicking oblique images is history. Figure 8 is an oblique mosaic of more than 100 high-resolution oblique images that have been stitched together to form a single oblique mosaic. By zooming in, one can see the detail of this massive image. So after 90 years of being stuck in an ortho world, the wheel has come full circle.
Delivering Success in the Field
In the mid-1980s, with Congress considering more than 350 bases and facilities for closure, accurate defensible data were necessary. Geographic information system (GIS) analysis played a big part in the final determination and defense of the closures. As a career U.S. Navy officer, I helped establish the Navy's first GIS operation to perform the analysis needed for the Navywide 1987 base closure study, now called the Base Realignment Commission (BRAC).
Experiencing the power and effectiveness of GIS, I decided to make it my second career. Completing post-graduate work in GIS, I went on to the position of GIS manager for the Atlanta Regional Commission (ARC).
For 12 years we ran a typical GIS operation, including base map creation using orthoimagery. We published our GIS data and even conducted regular Esri training classes. However, we had limited participation by our first responders and non-GIS employees.
In 2005, that limited participation changed. We started using georeferenced metric oblique imagery, and it had a dramatic impact on our early adopter counties. In one year of oblique imagery integration, we saw a 20-fold increase in GIS users.
It was apparent the oblique images were easier to comprehend, but I didn't appreciate how much until I personally observed the effect on non-GIS-trained users. Jack Maguire, the GIS manager for Lexington County, S.C., experienced the same effect. He coined a phrase, saying most people have map blindness because many citizens have difficulty reading and understanding blueprints, maps or even orthoimagery. By comparison, oblique imagery made perception much easier and significantly faster.
Rob Jessen, GIS coordinator for Virginia Beach, Va., had a similar experience. He found that council meetings went much quicker because everyone was able to get on the same page, understanding the issues in the context of their locations. The police department and SWAT team found the imagery especially useful in conducting daily police work.
I subsequently learned that research in visual perception found that limiting subjects to only ortho views of objects slowed perception because our natural environment is a 3-D oblique world. I found the real power of the oblique imagery was in combining it with GIS data overlays.
In the Atlanta region we were able to see documented evidence that our basic GIS data combined with oblique imagery saved lives. Firefighters found that using oblique imagery with GIS overlays to pre-plan their actions on the way to a fire reduced the fire containment time 60-90 seconds.
SWAT team planning in the apprehension of courtroom shooter Brian Nichols is another example. The apprehension was thoroughly planned and the execution so quick and overwhelming that the apprehension resulted in no shots being fired. ” Art Kalinski

